73

Let's say your Java program is taking 100% CPU. It has 50 threads. You need to find which thread is guilty. I have not found a tool that can help. Currently I use the following very time consuming routine:

  1. Run jstack <pid>, where pid is the process id of a Java process. The easy way to find it is to run another utility included in the JDK - jps. It is better to redirect jstack's output to a file.
  2. Search for "runnable" threads. Skip those that wait on a socket (for some reason they are still marked runnable).
  3. Repeat steps 1 and 2 a couple of times and see if you can locate a pattern.

Alternatively, you could attach to a Java process in Eclipse and try to suspend threads one by one, until you hit the one that hogs CPU. On a one-CPU machine, you might need to first reduce the Java process's priority to be able to move around. Even then, Eclipse often isn't able to attach to a running process due to a timeout.

I would have expected Sun's visualvm tool to do this.

Does anybody know of a better way?

Eddie
  • 53,828
  • 22
  • 125
  • 145
Gene Vayngrib
  • 833
  • 1
  • 8
  • 8

12 Answers12

95

Identifying which Java Thread is consuming most CPU in production server.

Most (if not all) productive systems doing anything important will use more than 1 java thread. And when something goes crazy and your cpu usage is on 100%, it is hard to identify which thread(s) is/are causing this. Or so I thought. Until someone smarter than me showed me how it can be done. And here I will show you how to do it and you too can amaze your family and friends with your geek skills.

A Test Application

In order to test this, we need a test application. So I will give you one. It consists of 3 classes:

  • A HeavyThread class that does something CPU intensive (computing MD5 hashes)
  • A LightThread class that does something not-so-cpu-intensive (counting and sleeping).
  • A StartThreads class to start 1 cpu intensive and several light threads.

Here is code for these classes:

import java.security.MessageDigest;
import java.security.NoSuchAlgorithmException;
import java.util.UUID;

/**
 * thread that does some heavy lifting
 *
 * @author srasul
 *
 */
public class HeavyThread implements Runnable {

        private long length;

        public HeavyThread(long length) {
                this.length = length;
                new Thread(this).start();
        }

        @Override
        public void run() {
                while (true) {
                        String data = "";

                        // make some stuff up
                        for (int i = 0; i < length; i++) {
                                data += UUID.randomUUID().toString();
                        }

                        MessageDigest digest;
                        try {
                                digest = MessageDigest.getInstance("MD5");
                        } catch (NoSuchAlgorithmException e) {
                                throw new RuntimeException(e);
                        }

                        // hash the data
                        digest.update(data.getBytes());
                }
        }
}


import java.util.Random;

/**
 * thread that does little work. just count & sleep
 *
 * @author srasul
 *
 */
public class LightThread implements Runnable {

        public LightThread() {
                new Thread(this).start();
        }

        @Override
        public void run() {
                Long l = 0l;
                while(true) {
                        l++;
                        try {
                                Thread.sleep(new Random().nextInt(10));
                        } catch (InterruptedException e) {
                                e.printStackTrace();
                        }
                        if(l == Long.MAX_VALUE) {
                                l = 0l;
                        }
                }
        }
}


/**
 * start it all
 *
 * @author srasul
 *
 */
public class StartThreads {

        public static void main(String[] args) {
                // lets start 1 heavy ...
                new HeavyThread(1000);

                // ... and 3 light threads
                new LightThread();
                new LightThread();
                new LightThread();
        }
}

Assuming that you have never seen this code, and all you have a PID of a runaway Java process that is running these classes and is consuming 100% CPU.

First let's start the StartThreads class.

$ ls
HeavyThread.java  LightThread.java  StartThreads.java
$ javac *
$ java StartThreads &

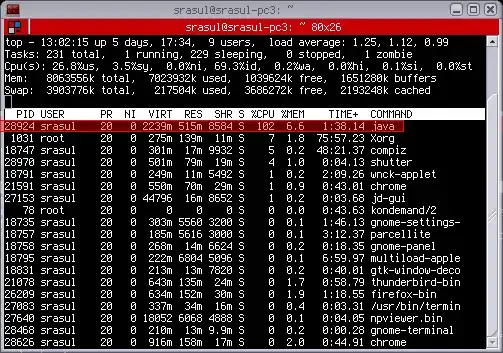
At this stage a Java process is running should be taking up 100 cpu. In my top I see: screenshot of top output

In top press Shift-H which turns on Threads. The man page for top says:

   -H : Threads toggle
        Starts top with the last remembered 'H' state reversed.  When
        this  toggle is On, all individual threads will be displayed.
        Otherwise, top displays a  summation  of  all  threads  in  a
        process.

And now in my top with Threads display turned ON i see: top screenshot with threads displayed

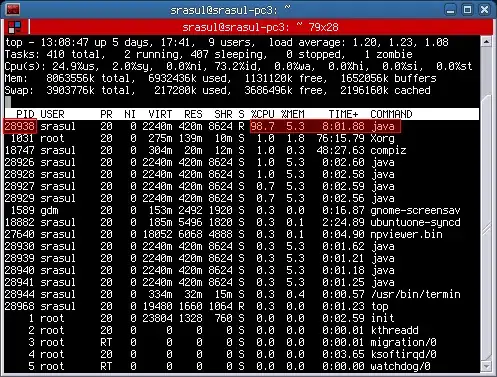
And I have a java process with PID 28294. Lets get the stack dump of this process using jstack:

$ jstack 28924
2010-11-18 13:05:41
Full thread dump Java HotSpot(TM) 64-Bit Server VM (17.0-b16 mixed mode):

"Attach Listener" daemon prio=10 tid=0x0000000040ecb000 nid=0x7150 waiting on condition [0x0000000000000000]
   java.lang.Thread.State: RUNNABLE

"DestroyJavaVM" prio=10 tid=0x00007f9a98027800 nid=0x70fd waiting on condition [0x0000000000000000]
   java.lang.Thread.State: RUNNABLE

"Thread-3" prio=10 tid=0x00007f9a98025800 nid=0x710d waiting on condition [0x00007f9a9d543000]
   java.lang.Thread.State: TIMED_WAITING (sleeping)
    at java.lang.Thread.sleep(Native Method)
    at LightThread.run(LightThread.java:21)
    at java.lang.Thread.run(Thread.java:619)

"Thread-2" prio=10 tid=0x00007f9a98023800 nid=0x710c waiting on condition [0x00007f9a9d644000]
   java.lang.Thread.State: TIMED_WAITING (sleeping)
    at java.lang.Thread.sleep(Native Method)
    at LightThread.run(LightThread.java:21)
    at java.lang.Thread.run(Thread.java:619)

"Thread-1" prio=10 tid=0x00007f9a98021800 nid=0x710b waiting on condition [0x00007f9a9d745000]
   java.lang.Thread.State: TIMED_WAITING (sleeping)
    at java.lang.Thread.sleep(Native Method)
    at LightThread.run(LightThread.java:21)
    at java.lang.Thread.run(Thread.java:619)

"Thread-0" prio=10 tid=0x00007f9a98020000 nid=0x710a runnable [0x00007f9a9d846000]
   java.lang.Thread.State: RUNNABLE
    at sun.security.provider.DigestBase.engineReset(DigestBase.java:139)
    at sun.security.provider.DigestBase.engineUpdate(DigestBase.java:104)
    at java.security.MessageDigest$Delegate.engineUpdate(MessageDigest.java:538)
    at java.security.MessageDigest.update(MessageDigest.java:293)
    at sun.security.provider.SecureRandom.engineNextBytes(SecureRandom.java:197)
    - locked <0x00007f9aa457e400> (a sun.security.provider.SecureRandom)
    at sun.security.provider.NativePRNG$RandomIO.implNextBytes(NativePRNG.java:257)
    - locked <0x00007f9aa457e708> (a java.lang.Object)
    at sun.security.provider.NativePRNG$RandomIO.access$200(NativePRNG.java:108)
    at sun.security.provider.NativePRNG.engineNextBytes(NativePRNG.java:97)
    at java.security.SecureRandom.nextBytes(SecureRandom.java:433)
    - locked <0x00007f9aa4582fc8> (a java.security.SecureRandom)
    at java.util.UUID.randomUUID(UUID.java:162)
    at HeavyThread.run(HeavyThread.java:27)
    at java.lang.Thread.run(Thread.java:619)

"Low Memory Detector" daemon prio=10 tid=0x00007f9a98006800 nid=0x7108 runnable [0x0000000000000000]
   java.lang.Thread.State: RUNNABLE

"CompilerThread1" daemon prio=10 tid=0x00007f9a98004000 nid=0x7107 waiting on condition [0x0000000000000000]
   java.lang.Thread.State: RUNNABLE

"CompilerThread0" daemon prio=10 tid=0x00007f9a98001000 nid=0x7106 waiting on condition [0x0000000000000000]
   java.lang.Thread.State: RUNNABLE

"Signal Dispatcher" daemon prio=10 tid=0x0000000040de4000 nid=0x7105 runnable [0x0000000000000000]
   java.lang.Thread.State: RUNNABLE

"Finalizer" daemon prio=10 tid=0x0000000040dc4800 nid=0x7104 in Object.wait() [0x00007f9a97ffe000]
   java.lang.Thread.State: WAITING (on object monitor)
    at java.lang.Object.wait(Native Method)
    - waiting on <0x00007f9aa45506b0> (a java.lang.ref.ReferenceQueue$Lock)
    at java.lang.ref.ReferenceQueue.remove(ReferenceQueue.java:118)
    - locked <0x00007f9aa45506b0> (a java.lang.ref.ReferenceQueue$Lock)
    at java.lang.ref.ReferenceQueue.remove(ReferenceQueue.java:134)
    at java.lang.ref.Finalizer$FinalizerThread.run(Finalizer.java:159)

"Reference Handler" daemon prio=10 tid=0x0000000040dbd000 nid=0x7103 in Object.wait() [0x00007f9a9de92000]
   java.lang.Thread.State: WAITING (on object monitor)
    at java.lang.Object.wait(Native Method)
    - waiting on <0x00007f9aa4550318> (a java.lang.ref.Reference$Lock)
    at java.lang.Object.wait(Object.java:485)
    at java.lang.ref.Reference$ReferenceHandler.run(Reference.java:116)
    - locked <0x00007f9aa4550318> (a java.lang.ref.Reference$Lock)

"VM Thread" prio=10 tid=0x0000000040db8800 nid=0x7102 runnable 

"GC task thread#0 (ParallelGC)" prio=10 tid=0x0000000040d6e800 nid=0x70fe runnable 

"GC task thread#1 (ParallelGC)" prio=10 tid=0x0000000040d70800 nid=0x70ff runnable 

"GC task thread#2 (ParallelGC)" prio=10 tid=0x0000000040d72000 nid=0x7100 runnable 

"GC task thread#3 (ParallelGC)" prio=10 tid=0x0000000040d74000 nid=0x7101 runnable 

"VM Periodic Task Thread" prio=10 tid=0x00007f9a98011800 nid=0x7109 waiting on condition 

JNI global references: 910

From my top I see that the PID of the top thread is 28938. And 28938 in hex is 0x710A. Notice that in the stack dump, each thread has an nid which is dispalyed in hex. And it just so happens that 0x710A is the id of the thread:

"Thread-0" prio=10 tid=0x00007f9a98020000 nid=0x710a runnable [0x00007f9a9d846000]
   java.lang.Thread.State: RUNNABLE
    at sun.security.provider.DigestBase.engineReset(DigestBase.java:139)
    at sun.security.provider.DigestBase.engineUpdate(DigestBase.java:104)
    at java.security.MessageDigest$Delegate.engineUpdate(MessageDigest.java:538)
    at java.security.MessageDigest.update(MessageDigest.java:293)
    at sun.security.provider.SecureRandom.engineNextBytes(SecureRandom.java:197)
    - locked <0x00007f9aa457e400> (a sun.security.provider.SecureRandom)
    at sun.security.provider.NativePRNG$RandomIO.implNextBytes(NativePRNG.java:257)
    - locked <0x00007f9aa457e708> (a java.lang.Object)
    at sun.security.provider.NativePRNG$RandomIO.access$200(NativePRNG.java:108)
    at sun.security.provider.NativePRNG.engineNextBytes(NativePRNG.java:97)
    at java.security.SecureRandom.nextBytes(SecureRandom.java:433)
    - locked <0x00007f9aa4582fc8> (a java.security.SecureRandom)
    at java.util.UUID.randomUUID(UUID.java:162)
    at HeavyThread.run(HeavyThread.java:27)
    at java.lang.Thread.run(Thread.java:619)

And so you can confirm that the thread which is running the HeavyThread class is consuming most CPU.

In read world situations, it will probably be a bunch of threads that consume some portion of CPU and these threads put together will lead to the Java process using 100% CPU.

Summary

  • Run top
  • Press Shift-H to enable Threads View
  • Get PID of the thread with highest CPU
  • Convert PID to HEX
  • Get stack dump of java process
  • Look for thread with the matching HEX PID.
AlBlue
  • 23,254
  • 14
  • 71
  • 91
Vassilis Blazos
  • 1,560
  • 1
  • 14
  • 20
  • This is a very good approach. I believe this approach may not work when you are not managing threads, which often is the case when using frameworks such as Play. – Arul Dhesiaseelan Apr 23 '15 at 16:24
  • 6
    important detail: use lower case hex representation – okigan Feb 19 '16 at 04:09
  • Great post; works perfectly. get hex by typing 'xxx in hex' into google. Lower case for sure needed on ubuntu16 – otter606 May 20 '17 at 13:12
  • 4
    On *nix systems I'm using _printf 0x%x pid_ to get the hex-value – Micha Kops Feb 20 '18 at 12:05
  • Thanks for this details explanation. This really helped me. – Al-Alamin Apr 08 '18 at 06:17
  • Thanks, this helped me! You can also use `kill -3 ` to get the full thread dump of a java process in its stdout. – tsl0922 Sep 21 '18 at 02:15
  • Another alternative to `kill -3` suggested above and `jstack` from the answer is `jcmd Thread.print`. This has the benefit of printing the dump out in the stdout of `jcmd` process, not the JVMs. This is handy if the JVMs stdout is being piped somewhere not convenient to you. – markdsievers Oct 14 '20 at 01:07
  • +1 this helped me find a MEMORY issue! Long story short, I had a CPU pinned server but I wasn't paying enough attention to the memory stats. After using this answer it was revealed the 2 GC JVM threads where consuming all the available CPU cycles in order to free memory (which was exhausted)! – markdsievers Oct 14 '20 at 01:10
22

jvmtop can show you the top consuming threads:

    TID NAME                                 STATE     CPU    TOTALCPU
     25 http-8080-Processor13                RUNNABLE  4.55%     1.60%
 128022 RMI TCP Connection(18)-10.101.       RUNNABLE  1.82%     0.02%
  36578 http-8080-Processor164               RUNNABLE  0.91%     2.35%
 128026 JMX server connection timeout   TIMED_WAITING  0.00%     0.00%
MRalwasser
  • 15,605
  • 15
  • 101
  • 147
  • 2
    Does anyone know how this TID can be correlated to a thread dump? They don't match the "tid" or "nid" identifiers I'm seeing in my thread dumps (after converting them to hex)? – Tom Nov 08 '13 at 10:41
  • This was perfect for my usage – Sanjiv Jivan Mar 09 '17 at 17:16
20

Try looking at the Hot Thread Detector plugin for visual VM -- it uses the ThreadMXBean API to take multiple CPU consumption samples to find the most active threads. It's based on a command-line equivalent from Bruce Chapman which might also be useful.

SiHa
  • 7,830
  • 13
  • 34
  • 43
Cowan
  • 37,227
  • 11
  • 66
  • 65
  • 1
    I tried Bruce Chapman's command line Hot Thread detector and it worked for me (it needed some class from tools.jar so I had to copy tools.jar to jre/lib/ext on my Ubuntu Jaunty (9.04) with Sun Java 6 update 13). I prefer a command line tool in this case since system is very usually so slow that GUI tools are a real pain. – Gene Vayngrib Jun 02 '09 at 23:18
  • 6
    5 years later, the link to Bruce Chapman's file is not working anymore. You can still read his post though, but not download any of his files. – Eduardo Bezerra Sep 22 '14 at 09:10
  • @EduardoBezerra: downloading seems to work again – serv-inc Aug 30 '21 at 06:39
11

Just run up JVisualVM, connect to your app and and use the thread view. The one which remains continually active is your most likely culprit.

Lawrence Dol
  • 63,018
  • 25
  • 139
  • 189
  • 1
    Even with JConsole(bundled with Java 1.5 and up) you can do the same. – adrian.tarau May 31 '09 at 02:27
  • 1
    JVisualVM is bundled with J6 too. – Lawrence Dol May 31 '09 at 06:56
  • Any commercial Java profiler application will do the same, if for some reason you are stuck on an earlier version of the JDK. – Bill Michell Jun 01 '09 at 13:00
  • @Bill: Good point. I have personally used JProfiler for years with code from Java 1 on and found it to work very well. – Lawrence Dol Jun 01 '09 at 16:55
  • Thank you. JVisualVM indeed shows threads as runnable or not. But that does not mean they are actually running, some may be sitting on a socket - not sure why they are still marked as runnable - note that some threads are always green in JVisualVM threads view. So it may give you an idea but not a definite answer to what thread is hogging cpu. – Gene Vayngrib Jun 02 '09 at 23:26
  • Yes, it seems that the JVM considers any thread in a native method other than wait() to be running. It's annoying, but it still seems easy to eliminate them to find the real culprit. – Lawrence Dol Jun 10 '09 at 16:53
6

Have a look at the Top Threads plugin for JConsole.

Mark
  • 28,783
  • 8
  • 63
  • 92
4

I would recommend taking a look at Arthas tool open sourced by Alibaba.

It contains a bunch of useful commands that can help you debug your production code:

  • Dashboard: Overview of Your Java Process
  • SC: Search Class Loaded by Your JVM
  • Jad: Decompile Class Into Source Code
  • Watch: View Method Invocation Input and Results
  • Trace: Find the Bottleneck of Your Method Invocation
  • Monitor: View Method Invocation Statistics
  • Stack: View Call Stack of the Method
  • Tt: Time Tunnel of Method Invocations

Example of the dashboard: dashboard

Serge
  • 2,574
  • 18
  • 26
2

Use ps -eL or top -H -p <pid>, or if you need to see and monitor in real time, run top (then shift H), to get the Light Weight Process ( LWP aka threads) associated with the java process.

root@xxx:/# ps -eL
PID LWP TTY TIME CMD
 1 1 ? 00:00:00 java
 1 7 ? 00:00:01 java
 1 8 ? 00:07:52 java
 1 9 ? 00:07:52 java
 1 10 ? 00:07:51 java
 1 11 ? 00:07:52 java
 1 12 ? 00:07:52 java
 1 13 ? 00:07:51 java
 1 14 ? 00:07:51 java
 1 15 ? 00:07:53 java
…
 1 164 ? 00:00:02 java
 1 166 ? 00:00:02 java
 1 169 ? 00:00:02 java

Note LWP= Lightweight Process; In Linux, a thread is associated with a process so that it can be managed in the kernel; LWP shares files and other resources with the parent process. Now let us see the threads that are taking most time

 1 8 ? 00:07:52 java
 1 9 ? 00:07:52 java
 1 10 ? 00:07:51 java
 1 11 ? 00:07:52 java
 1 12 ? 00:07:52 java
 1 13 ? 00:07:51 java
 1 14 ? 00:07:51 java
 1 15 ? 00:07:53 java

Jstack is a JDK utility to print Java Stack; It prints thread of the form.

Familiarize yourself with others cool JDK tools as well (jcmd jstat jhat jmap jstack etc — https://docs.oracle.com/javase/8/docs/technotes/tools/unix/)

jstack -l <process id>

The nid, Native thread id in the stack trace is the one that is connected to LWT in linux (https://gist.github.com/rednaxelafx/843622)

“GC task thread#0 (ParallelGC)” os_prio=0 tid=0x00007fc21801f000 nid=0x8 runnable

The nid is given in Hex; So we convert the thread id taking the most time 8,9,10,11,12,13,14,15 in DEC = 8,9,A, B,C,D,E,F in HEX.

(note that this particular stack was taken from Java in a Docker container, with a convenient process if of 1 ) Let us see the thread with this ids..

“GC task thread#0 (ParallelGC)” os_prio=0 tid=0x00007fc21801f000 nid=0x8 runnable
“GC task thread#1 (ParallelGC)” os_prio=0 tid=0x00007fc218020800 nid=0x9 runnable
“GC task thread#2 (ParallelGC)” os_prio=0 tid=0x00007fc218022800 nid=0xa runnable
“GC task thread#3 (ParallelGC)” os_prio=0 tid=0x00007fc218024000 nid=0xb runnable
“GC task thread#4 (ParallelGC)” os_prio=0 tid=0x00007fc218026000 nid=0xc runnable
“GC task thread#5 (ParallelGC)” os_prio=0 tid=0x00007fc218027800 nid=0xd runnable
“GC task thread#6 (ParallelGC)” os_prio=0 tid=0x00007fc218029800 nid=0xe runnable
“GC task thread#7 (ParallelGC)” os_prio=0 tid=0x00007fc21802b000 nid=0xf runnable

All GC related threads; No wonder it was taking lot of CPU time; But then is GC a problem here.

Use jstat (not jstack !) utility to have a quick check for GC.

jstat -gcutil <pid>

Alex Punnen
  • 5,287
  • 3
  • 59
  • 71
2

If you're running under Windows, try Process Explorer. Bring up the properties dialog for your process, then select the Threads tab.

jdigital
  • 11,926
  • 4
  • 34
  • 51
  • We just used this approach for locating a Thread loop and it worked fine. The Eclipse debug view is great for starting and stopping threads. You can pause all of them and then reactivate them one by one to see which one is spinning. – Jim Ferrans May 31 '09 at 18:33
  • Alternately you can use this method to find the problem thread, record the thread ID, use java visual VM to do a thread dump, and find the name of the problem thread by comparing the thread IDs. (note the java visualVM thread ID is labeled as nid, and it is in hexadecimal) – Reid Jan 17 '15 at 00:02
1

Take a thread dump. Wait for 10 seconds. Take another thread dump. Repeat one more time. Inspect the thread dumps and see which threads are stuck at the same place, or processing the same request. This is a manual way of doing it, but often useful.

talonx
  • 1,762
  • 1
  • 15
  • 33
0

This is a kind of hacky way, but it seems like you could fire the application up in a debugger, and then suspend all the threads, and go through the code and find out which one isn't blocking on a lock or an I/O call in some kind of loop. Or is this like what you've already tried?

Paul Fisher
  • 9,618
  • 5
  • 37
  • 53
  • yep, this is what I was doing more or less. But this is quite tedious, especially if there is many threads and when on a one-CPU machine, which is the case of a small EC2 instance and when you run in VirtualBox. – Gene Vayngrib May 31 '09 at 01:47
0

An option you could consider is querying your threads for the answer from within application. Via the ThreadMXBean you can query CPU usage of threads from within your Java application and query stack traces of the offending thread(s).

The ThreadMXBean option allows you to build this kind of monitoring into your live application. It has negligible impact and has the distinct advantage that you can make it do exactly what you want.

Neil Coffey
  • 21,615
  • 7
  • 62
  • 83
0

If you suspect VisualVM is a good tool, try it (because it does this) Find out the threads(s) only helps you in the general direction of why it is consuming so much CPU.

However, if its that obvious I would go straight to using a profiler to find out why you are consuming so much CPU.

Peter Lawrey
  • 525,659
  • 79
  • 751
  • 1,130