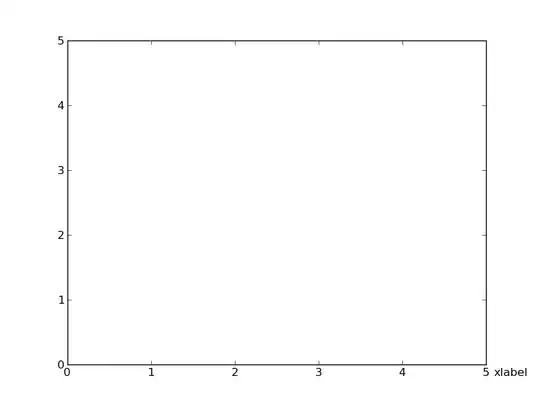
When setting the xlabel, the x parameter assigns the position in axis units, so 0 is the origin and 1 is the right edge of the plot. y is ignored as it's expected to be a default value, just below the tick marks.
To override this behavior, you can set the position in axis units using the Axis set_label_coords method. You can use other units by also providing a transform.
Here is an example of this:
import matplotlib.pyplot as plt
import numpy as np

ax = plt.gca()
ax.set_xticks(np.arange(0,6,1))
label = ax.set_xlabel('Xlabel', fontsize = 9)
ax.xaxis.set_label_coords(1.05, -0.025)

plt.savefig('labelAtEnd.png')
plt.show()
Resulting in:

The x value (1.05) was chosen to position the label outside the Axes frame. The y value (-0.025) was chose as a best guess to the position you desired. Using a transform, it might be possible to automatically position the text in line with the Tick labels.
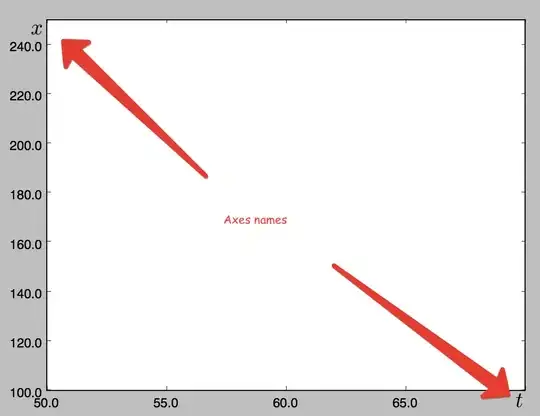
EDIT:
Here's an extended example using a transform. It is not necissarily more helpful to use the last ticklabel's transform, because it does not take into account the size of the text and how it is aligned. So to get a somewhat desired effect, I had to 1) use the same font size for my x label, 2) position the vertical alignment (va) to 'top', and 3) position the horizontal alignment to 'left'. The transform for each tick is set for data units for x (because it's an xaxis) and axis units for y (0 to 1), but displaced by a fixed padding (in pixels) from the x axis.
import matplotlib.pyplot as plt
import numpy as np

ax = plt.gca()
ax.set_xticks(np.arange(0,6,1))
ax.set_yticks(np.arange(0,6,1))
label = ax.set_xlabel('xlabel', ha='left', va = 'top', )#fontsize = 9)

# need to draw the figure first to position the tick labels
fig = plt.gcf()
fig.draw(fig.canvas.get_renderer())

# get a tick and will position things next to the last one
ticklab = ax.xaxis.get_ticklabels()[0]
trans = ticklab.get_transform()
ax.xaxis.set_label_coords(5.1, 0, transform=trans)

plt.savefig('labelAtEnd2.png')
plt.show()
This results in: