I'm producing a double panel figure in Mathematica. The Bottom panel has negative values on the y-axis and this causes the label on that axis, produced using FrameLabel, to be aligned a bit more to the left than the label on the top panel, which has positive values. I cannot join the panels to a single plot because the scales are different. A piece of code that reproduces the problem:
pad = 80;
Export["C:\\Users\\user\\Desktop\\stackoverflow.png",
Column[
{
Show[
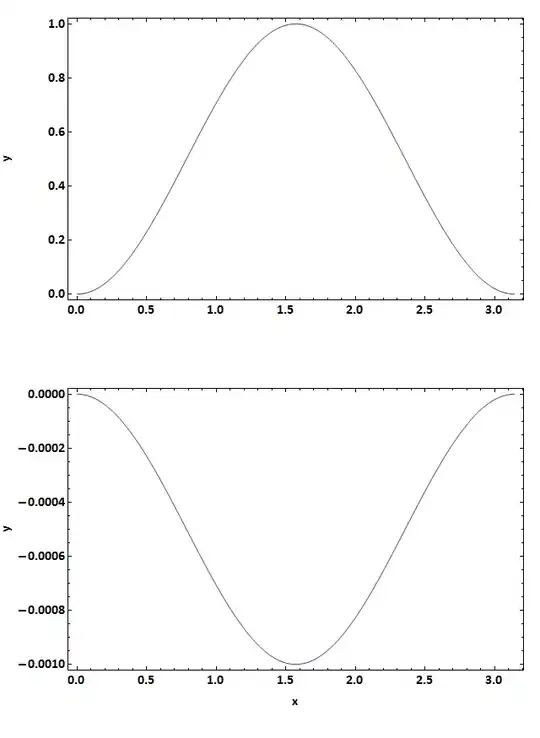
Plot[ Sin[x]^2, {x, 0, Pi},
FrameLabel -> {"", "y"},
BaseStyle -> {FontSize -> 16, FontWeight -> Bold,
FontFamily -> "Calibri"},
ImagePadding -> {{pad, pad/4}, {pad, pad/4}},
Frame -> {True, True, True, True}
]
, ImageSize -> 640]
,
Show[
Plot[ -Sin[x]^2/1000, {x, 0, Pi},
FrameLabel -> {"x", "y"},
BaseStyle -> {FontSize -> 16, FontWeight -> Bold,
FontFamily -> "Calibri"},
ImagePadding -> {{pad, pad/4}, {pad, pad/4}},
Frame -> {True, True, True, True}
]
, ImageSize -> 640]
}
]
]
This code produces the following figure, in which you can see that the y label is aligned differentyl in the top and bottom panels.

I would appreciate any help - I have to submit the figure (obviously no the above figure...) to the publisher ASAP for my paper to go to print... Thanks