I believe R can generate stem-and-leaf for ascii histograms, and scatter plots using this code from Matt Shotwell.
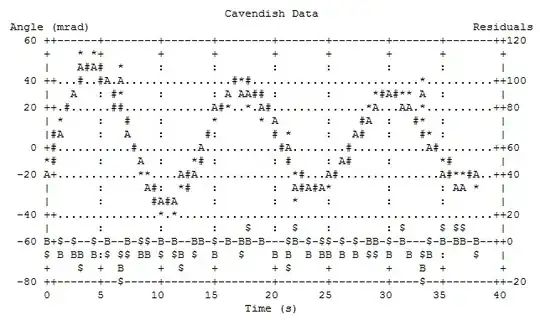
Can it also generate ASCII based line graphs, like this from GNUPlot?
I believe R can generate stem-and-leaf for ascii histograms, and scatter plots using this code from Matt Shotwell.
Can it also generate ASCII based line graphs, like this from GNUPlot?
You should look at the fairly recent txtplot package. Currently, it includes scatterplot, line plot, density plot, acf, and bar chart.
From the online help,
> txtplot(cars[,1], cars[,2])
    +----+------------+------------+-----------+------------+--+
120 +                                                     *    +
    |                                                          |
100 +                                                          +
    |                                                     * *  |
 80 +                           *         *                    +
    |                                        *       *    *    |
 60 +                           *              *               +
    |                              *    * *    *       *       |
 40 +                         *      *  * *  *                 +
    |                 *       * *    *  *    * *               |
 20 +         *       *  * *  * *  *                           +
    |            *    *  * *                                   |
    |  *      *    *                                           |
  0 +----+------------+------------+-----------+------------+--+
         5           10           15          20           25
I know there is support for basic interaction between R and GnuPlot in the TeachingDemos package. Perhaps that can achieve what you want.