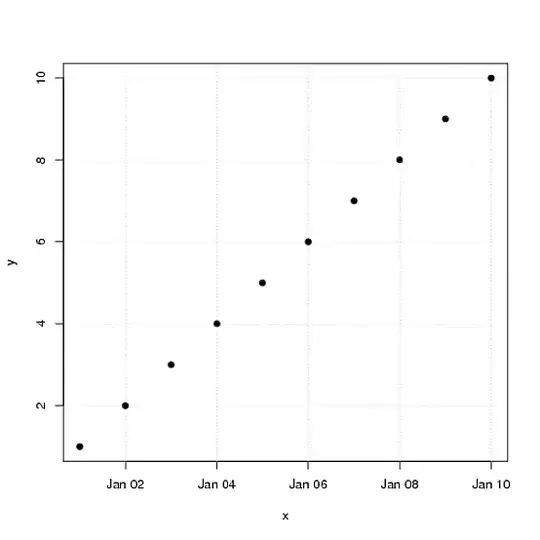
I have the following data:
x=strptime(20010101:20010110)
y=1:10
z=data.frame(x,y)
So my data is this:
            x  y
1  2001-01-01  1
2  2001-01-02  2
3  2001-01-03  3
4  2001-01-04  4
5  2001-01-05  5
6  2001-01-06  6
7  2001-01-07  7
8  2001-01-08  8
9  2001-01-09  9
10 2001-01-10 10
When I create a plot in base using:
plot(x,y)
grid(NULL,NULL)
My vertical grid does not align with the date tick marks. I know this seems like a pretty simple problem, but I have not found a solution to this anywhere. Is there a way to get the vertical grid to align with the date tick marks using base that does not require me to do this:
abline(v=as.numeric(strptime(c(20010102,20010104,20010106,20010108,20010110),'%Y%m%d')))
I have a lot of plots with different dates and I would really like to automate this as much as possible, hopefully using base.