Here is my take (using percentile ranks), which only assumes a univariate series of measurement is available (your column headed X). You may want to tweak it a little to work with your pre-computed cumulative frequencies, but that's not really difficult.
# generate some artificial data
reset
set sample 200
set table 'rnd.dat'
plot invnorm(rand(0))
unset table

# display the CDF
unset key
set yrange [0:1]
perc80=system("cat rnd.dat | sed '1,4d' | awk '{print $2}' | sort -n | \
          awk 'BEGIN{i=0} {s[i]=$1; i++;} END{print s[int(NR*0.8-0.5)]}'")
set arrow from perc80,0 to perc80,0.8 nohead lt 2 lw 2
set arrow from graph(0,0),0.8 to perc80,0.8 nohead lt 2 lw 2
plot 'rnd.dat' using 2:(1./200.) smooth cumulative
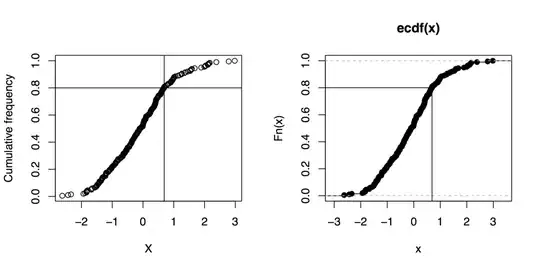
This yields the following output:
You can add as many percentile values as you want, of course; you just have to define a new variable, e.g. perc90, as well as ask for two other arrow commands, and replace every occurrence of 0.8 (ah... the joy of magic numbers!) by the desired one (in this case, 0.9).
Some explanations about the above code:
- I generated an artificial dataset which was saved on disk.
- The 80th percentile is compute using awk, but before that we need to
- remove the header generated by
table (first four lines); (we could ask awk to start at the 5th lines, but let's go with that.)
- keep only the second column;
- sort the entries.
- The awk command to compute the 80th percentile requires truncation, which is done as suggested here. (In R, I would simply use a function like
trunc(rank(x))/length(x) to get the percentile ranks.)
If you want to give R a shot, you can safely replace that long series of sed/awk commands with a call to R like
Rscript -e 'x=read.table("~/rnd.dat")[,2]; sort(x)[trunc(length(x)*.8)]'
assuming rnd.dat is in your home directory.
Sidenote: And if you can live without gnuplot, here are some R commands to do that kind of graphics (even not using the quantile function):
x <- rnorm(200)
xs <- sort(x)
xf <- (1:length(xs))/length(xs)
plot(xs, xf, xlab="X", ylab="Cumulative frequency")
## quick outline of the 80th percentile rank
perc80 <- xs[trunc(length(x)*.8)]
abline(h=.8, v=perc80)
## alternative solution
plot(ecdf(x))
segments(par("usr")[1], .8, perc80, .8)
segments(perc80, par("usr")[3], perc80, .8)