13

In the paper "The Riemann Hypothesis" by J. Brian Conrey in figure 6 there is a plot of the Fourier transform of the error term in the prime number theorem. See the plot to the left in the image below:

Plots from Conrey's paper on the Riemann hypothesis

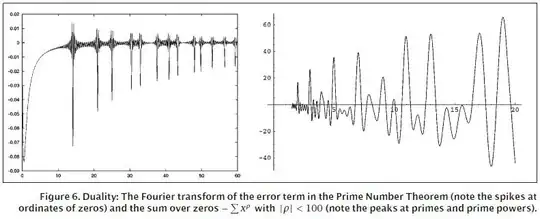
In a blog post called Primes out of Thin Air written by Chris King there is a Matlab program that plots the spectrum. See the plot to the right at the beginning of the post. A translation into Mathematica is possible:

Mathematica:

 scale = 10^6;
 start = 1;
 fin = 50;
 its = 490;
 xres = 600;
 y = N[Accumulate[Table[MangoldtLambda[i], {i, 1, scale}]], 10];
 x = scale;
 a = 1;
 myspan = 800;
 xres = 4000;
 xx = N[Range[a, myspan, (myspan - a)/(xres - 1)]];
 stpval = 10^4;
 F = Range[1, xres]*0;

For[t = 1, t <= xres, t++,
 For[yy=0, yy<=Log[x], yy+=1/stpval,
 F[[t]] =
 F[[t]] +
 Sin[t*myspan/xres*yy]*(y[[Floor[Exp[yy]]]] - Exp[yy])/Exp[yy/2];
 ]
 ]
 F = F/Log[x];
 ListLinePlot[F]

However, this is as I understand it the matrix formulation of the Fourier sine transform and it is therefore very costly to compute. I do NOT recommend running it because it already crashed my computer once.

Is there a way in Mathematica utilising the Fast Fourier Transform, to plot the spectrum with spikes at x-values equal to imaginary part of Riemann zeta zeros?

I have tried the commands FourierDST and Fourier without success. The problem seems to be that the variable yy in the code is included in both Sin[t*myspan/xres*yy] and (y[[Floor[Exp[yy]]]] - Exp[yy])/Exp[yy/2].

EDIT: 20.1.2012, I changed the line:

For[yy = 0, yy <= Log[x], 1/stpval++,

into the following:

For[yy = 0, yy/stpval <= Log[x], yy++,

EDIT: 22.1.2012, From Heike's comment, changed:

For[yy = 0, yy/stpval <= Log[x], yy++,

into:

For[yy=0, yy<=Log[x], yy+=1/stpval,

Mats Granvik
  • 233
  • 5
  • 15
  • 1
    You get an infinite loop because your inner `For` loop is stuck at `yy=0`. You probably need to increment `yy` rather than `stepval` in the third argument of the `For` loop. – kglr Jan 20 '12 at 02:31
  • Thank you for the correction! The problem still persists though. This time the program runs without freezing my desktop computer but it ends with the output: No more memory available. Mathematica kernel has shut down. Try quitting other applications and then retry. – Mats Granvik Jan 20 '12 at 12:22
  • 1
    @Mats: Just so you know, it's [bad form](http://meta.stackexchange.com/q/64068/156389) to have the [same question](http://math.stackexchange.com/q/100597/954) posted on two sites. You should have flagged it for moderator attention and asked to be migrated, or just deleted the question yourself before reposting over here. – Simon Jan 20 '12 at 12:56
  • 1
    In the matlab code in the blog post, `yy` runs from `0` to `log(X)` with increments of `1/stpval` whereas in your code `yy` runs from `0` to `stpval Log[x]` with increments of `1`. You probably want to do something like `For[yy=0, yy<=Log[x], yy+=1/stpval, ... ]`. – Heike Jan 20 '12 at 17:42

1 Answers1

12

What about this? I've rewritten the sine transform slightly using the identity Exp[a Log[x]]==x^a

Clear[f]
scale = 1000000;
f = ConstantArray[0, scale];
f[[1]] = N@MangoldtLambda[1];
Monitor[Do[f[[i]] = N@MangoldtLambda[i] + f[[i - 1]], {i, 2, scale}], i]

xres = .002;
xlist = Exp[Range[0, Log[scale], xres]];
tmax = 60;
tres = .015;
Monitor[errList = Table[(xlist^(-1/2 + I t).(f[[Floor[xlist]]] - xlist)), 
  {t, Range[0, 60, tres]}];, t]

ListLinePlot[Im[errList]/Length[xlist], DataRange -> {0, 60}, 
  PlotRange -> {-.09, .02}, Frame -> True, Axes -> False]

which produces

Mathematica graphics

Heike
  • 24,102
  • 2
  • 31
  • 45
  • Great! This fills a gap in my education. Just one detail, the value of the variable `span` should be 20000 or more, with the line `span = 20000;` included before `xlist`. Many thanks. – Mats Granvik Jan 24 '12 at 14:17
  • @Mats `span` and `scale` are the same. I used `span` in my notebook but forgot to replace all occurrences of `span` with `scale` when copy-pasting the code here. I'll correct it to make it consistent. – Heike Jan 24 '12 at 14:26
  • I posted a question on math se using your code: http://math.stackexchange.com/questions/105628/what-are-the-exact-values-of-the-local-minima-in-this-spectrum – Mats Granvik Feb 05 '12 at 09:41