24

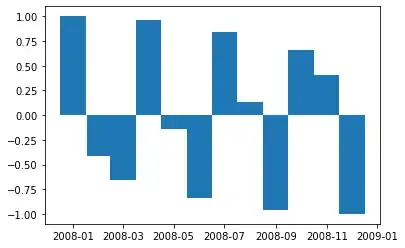
When I plot data sampled per month with bars, their width is very thin. If I set X axis minor locator to DayLocator(), I can see the bars width is adjusted to 1 day, but I would like them to fill a whole month.

I tried to set the minor ticks locator to MonthLocator() without effect.

[edit]

Maybe an example will be more explicit, here is an ipython -pylab example of what I mean :

x = [datetime.datetime(2008, 1, 1, 0, 0),
    datetime.datetime(2008, 2, 1, 0, 0),
    datetime.datetime(2008, 3, 1, 0, 0),
    datetime.datetime(2008, 4, 1, 0, 0),
    datetime.datetime(2008, 5, 1, 0, 0),
    datetime.datetime(2008, 6, 1, 0, 0),
    datetime.datetime(2008, 7, 1, 0, 0),
    datetime.datetime(2008, 8, 1, 0, 0),
    datetime.datetime(2008, 9, 1, 0, 0),
    datetime.datetime(2008, 10, 1, 0, 0),
    datetime.datetime(2008, 11, 1, 0, 0),
    datetime.datetime(2008, 12, 1, 0, 0)]

y = cos(numpy.arange(12) * 2)

bar(x, y)

This gives 12 2 pixels wide bars, I would like them to be wider and extend from month to month.
cottontail
  • 10,268
  • 18
  • 50
  • 51
Luper Rouch
  • 9,304
  • 7
  • 42
  • 56

2 Answers2

61

Just use the width keyword argument:

bar(x, y, width=30)

Or, since different months have different numbers of days, to make it look good you can use a sequence:

bar(x, y, width=[(x[j+1]-x[j]).days for j in range(len(x)-1)] + [30])
Jouni K. Seppänen
  • 43,139
  • 5
  • 71
  • 100
0

Newer matplotlib versions (e.g. 3.7.0) can handle datetime and timedelta directly, so just computing the difference (perhaps with np.diff()) would suffice to compute a list of widths.

import datetime
import numpy as np
import matplotlib.pyplot as plt

x = [datetime.datetime(2008, i, 1) for i in range(1, 13)]
y = np.cos(np.arange(12) * 2)

# plot a bar chart with timedelta x-axis
plt.bar(x, y, width=[*np.diff(x), datetime.timedelta(31)]);

Another option is to just plot a bar chart without worrying about x-axis but add datetime data as ticklabels later.

plt.bar(range(len(x)), y)
plt.xticks(range(0, len(x), 2), [d.strftime('%Y-%m') for d in x[::2]]);

result

cottontail
  • 10,268
  • 18
  • 50
  • 51