2

How can I use kcachegrind to get a non-graphical tree of all my function calls, in the order they were called?

There are two typical ways to look at profiling data:

  • sorted by the most expensive entries
  • sorted in order of execution

I'm looking for the latter. I can sort of get it with the "Call Graph" tab, but this omits some data, and it can be confusing the way it represents loops. I'd prefer a text view, like this:
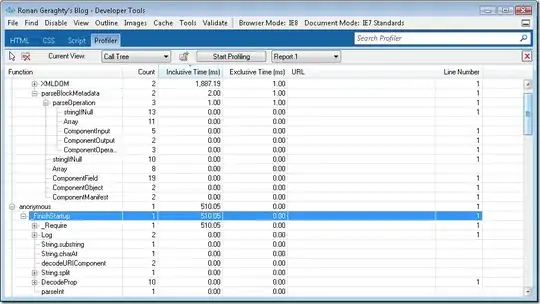
alt text
(source: msdn.com)

Glorfindel
  • 21,988
  • 13
  • 81
  • 109
JW.
  • 50,691
  • 36
  • 115
  • 143

1 Answers1

0

It's in "All Callees" tab, which is located in lower-right subarea.

  • I don't think so. That doesn't show all of the immediate callees. It shows just the most expensive ones, including ones at a distance greater than one. I'm looking for all the immediate callees, in the order they were executed. – JW. May 25 '09 at 16:43