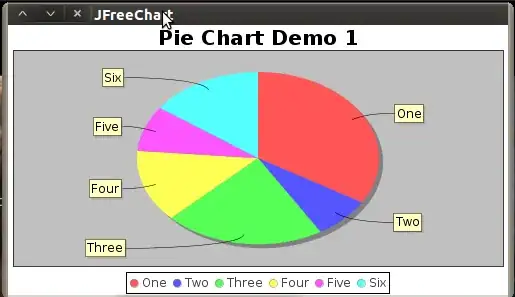
JFreeChart seems to be working, except for all the text. It just doesn't show up at all, and I've no idea why. I attached a picture of a window with a pie graph that I got from a tutorial site. As you can see, the text isn't visible. (sorry my twitter feed was really long)
Thanks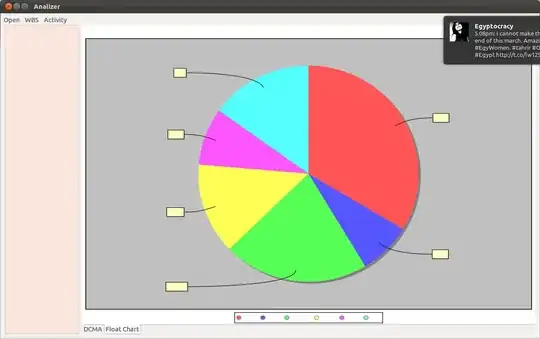
Edit:
Here is the code that generates the above graph:
package analyzer_main;

import java.awt.Font;

public class FloatChart extends Composite implements Screen {

    JFreeChart floatChart;

    public FloatChart(Composite parent, int style){
        super(parent,style);
        createContents();
    }

    private void createContents(){
        this.setLayout(new FormLayout());
        floatChart = createChart(createDataset());
        ChartComposite chartComposite = new ChartComposite(this,SWT.NONE,floatChart, true);
        FormData fd_chartComposite = new FormData();
        fd_chartComposite.left  = new FormAttachment(0);
        fd_chartComposite.right = new FormAttachment(100,0);
        fd_chartComposite.top   = new FormAttachment(0);
        fd_chartComposite.bottom= new FormAttachment(100,0);
        chartComposite.setLayoutData(fd_chartComposite);
    }

/** * Creates the Dataset for the Pie chart */

    private PieDataset createDataset() {
        DefaultPieDataset dataset = new DefaultPieDataset();
        dataset.setValue("One", new Double(43.2));
        dataset.setValue("Two", new Double(10.0));
        dataset.setValue("Three", new Double(27.5));
        dataset.setValue("Four", new Double(17.5));
        dataset.setValue("Five", new Double(11.0));
        dataset.setValue("Six", new Double(19.4));
        return dataset;
    }

    private JFreeChart createChart(PieDataset dataset) {

        JFreeChart chart = ChartFactory.createPieChart("Pie Chart Demo 1", // chart
                // title
                dataset, // data
                true, // include legend
                true, false);

        PiePlot plot = (PiePlot) chart.getPlot();
        plot.setSectionOutlinesVisible(false);
        plot.setLabelFont(new Font("SansSerif", Font.PLAIN, 12));
        plot.setNoDataMessage("No data available");
        plot.setCircular(false);
        plot.setLabelGap(0.02);
        return chart;
    }

    @Override
    public void Load() {
    }

}
As you can see, it's pretty much the same as from the tutorial.