4

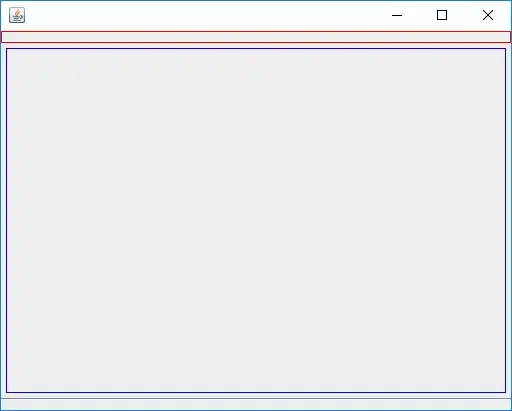
Matlab's ribbon function plots my matrix in the form of coloured ribbons, where ribbon number and point on the ribbon map to the row and column indices of the matrix, and the ribbon heights map to the element values. Each ribbon has its own colour.

I'm looking for a function that creates a plot like this, but where the colour indicates the height of the ribbon, i.e. the values in the matrix, similar to what surf and waterfall do. (Removing the black contour lines would also be neat.) How can I achieve this?
matlab ribbons

Tim
  • 13,904
  • 10
  • 69
  • 101

3 Answers3

2

ribboncoloredz.m just does that.

[x,y] = meshgrid(-3:.5:3,-3:.1:3);
z = peaks(x,y);
ribboncoloredZ(y,z);
xlabel('X');ylabel('Y');zlabel('Z');

example

Kouichi C. Nakamura
  • 850
  • 3
  • 10
  • 25
  • The submission boils down to setting some properties after calling `h = ribbon(y,z)`, i.e. `set(h, {'CData'}, get(h,'ZData'), 'FaceColor','interp','MeshStyle','column')` – Oleg Dec 07 '16 at 17:10
0

Same problem, my solution was to make my own function from the built-in one:

Open "ribbon.m" in the editor : edit ribbon.m

Save it wherever you want under another name, like ribbonColAmpl.m

Line 46 delete the surface argument "n*cc," before 'parent'. This is what controls the fixed color of the concatenated surfaces.

Save the file and use this new function instead of the original one: Voila!

0

Turns out the same effect can be achieved using waterfall:

h = waterfall(data);
set( h, 'LineWidth', 4 );
hidden off;

enter image description here

Tim
  • 13,904
  • 10
  • 69
  • 101