I am not sure how to track down the following crash:
It happens when Unloading a Designtime Package that is used in-house at my company. It is our code, thus it is our bug to fix, not a third party component vendor problem.
It apppears that a thread is involved, but since it happens in the Function ThreadProc in Classes.pas, I'm guessing it's a bare System/RTL thread without even a TThread class wrapper that I should be searching for in our code. (Question Part A: Is that so?)
The call stack contains none of my code, only the IDE itself, and the base function in the call stack is ntdll.RtlInitializeExceptionChain.
call stack example of an access violation in some TThread.Execute method that shows that the debugger gives no details on WHICH thread is involved:
 :7599b9bc KERNELBASE.RaiseException + 0x58
 :516b4965 ; c:\program files (x86)\embarcadero\rad studio\8.0\bin\exceptiondiag150.bpl
 :5003b058 NotifyNonDelphiException + $1C
 :77be6a8b ; ntdll.dll
 :77bb0143 ntdll.KiUserExceptionDispatcher + 0xf
 rtl.Classes.ThreadProc($CB9ED70)
rtl.System.ThreadWrapper($403E910)
:75fb339a kernel32.BaseThreadInitThunk + 0x12
:77bd9ed2 ntdll.RtlInitializeExceptionChain + 0x63
:77bd9ea5 ntdll.RtlInitializeExceptionChain + 0x36
When I try to view thread info, the second Delphi IDE that is my target executable, itself crashes, but I am able to continue to view information in my delphi debug host instance.
I am aware of techniques for debugging designtime packages, and I am using said techniques. That is, I have a first copy of delphi (BDS.exe) launching a second copy, because the package project, has set in its Run Parameters, in the Host Application edit box the main bds.exe for Delphi XE. (C:\Program Files (x86)\Embarcadero\RAD Studio\8.0\bin\bds.exe). Thus when I run my package in debug mode, it loads itself into the Delphi IDE.
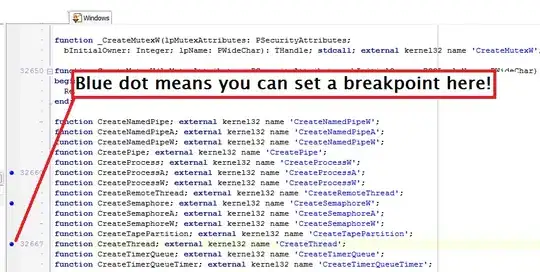
Question part B is: What is the best place to set a breakpoint so I can see non-TThread threads, as well as TThread-based threads being created? If there is no way to set a breakpoint, then how about an alternative means of finding what code is creating threads?
Update: I have found that setting a breakpoint in the line that reads Thread.Execute, in function ThreadProc, in Classes.pas, gets me a breakpoint hit on each TThread startup. That is enough to find threads started by a designtime or runtime package from its initialization section, but I'm hoping there exists an even lower level way to do this.