4

I have a dataset like so:

  | 0.1  0.2  0.3  0.4
----------------------
1 | 10   11   12   13
2 | 11   12   13   14
3 | 12   13   14   15
4 | 13   14   15   16

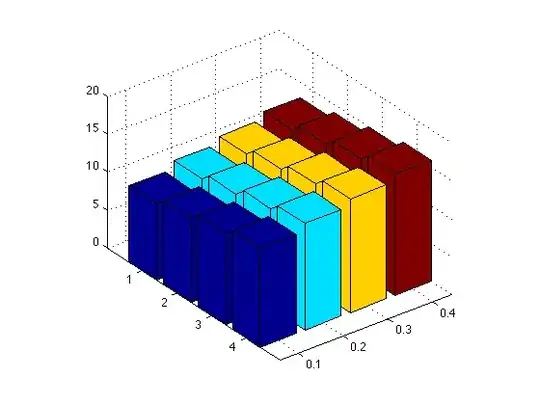
I want to plot a 3D surface graph in matlab such that the column headings will be on the y axis, the row headings will be on the x axis and the remaining values will determine the height of the point on the z axis.

I have had a look around at lots of different example and I can't work out how to achieve this. At the moment I have got the following:

Y = [0.1 0.2 0.3 0.4];
X = [1 2 3 4];
Z = [10 11 12 13; 11 12 13 14; 12 13 14 15; 13 14 15 16];

Please could someone help me out?

JasonMArcher
  • 14,195
  • 22
  • 56
  • 52

2 Answers2

4
surf(X,Y,Z)

Oli
  • 15,935
  • 7
  • 50
  • 66
  • Thankyou! I didn't realise it was so simple - I was massively overcomplicating my attempts. –  Nov 26 '11 at 21:39
1

May a bar plot yield the desired picture?

Y = [0.1 0.2 0.3 0.4];
X = [1 2 3 4];
Z = [10 11 12 13; 11 12 13 14; 12 13 14 15; 13 14 15 16];

figure;
bar3(Z)
set(gca(gcf), 'xticklabel',{'0.1','0.2','0.3','0.4'})

3d plot

zellus
  • 9,617
  • 5
  • 39
  • 56
  • Hello, thank you for this response. Do you are sure that your answer is true? If yes, so I can use it :) – Christina Sep 19 '14 at 10:58