59

Can someone please help me fill in the following function in R:

#data is a single vector of decimal values
normally.distributed <- function(data) {
if(data is normal)
return(TRUE)
else
return(NO)
}
pnuts
  • 58,317
  • 11
  • 87
  • 139
CodeGuy
  • 28,427
  • 76
  • 200
  • 317
  • 2
    It's not really clear what you're asking. Are you looking for a function to evaluate whether a vector of numbers look like random draws from a normal distribution? If so, why not just say that? – Karl Oct 16 '11 at 01:40

8 Answers8

188

Normality tests don't do what most think they do. Shapiro's test, Anderson Darling, and others are null hypothesis tests AGAINST the the assumption of normality. These should not be used to determine whether to use normal theory statistical procedures. In fact they are of virtually no value to the data analyst. Under what conditions are we interested in rejecting the null hypothesis that the data are normally distributed? I have never come across a situation where a normal test is the right thing to do. When the sample size is small, even big departures from normality are not detected, and when your sample size is large, even the smallest deviation from normality will lead to a rejected null.

For example:

> set.seed(100)
> x <- rbinom(15,5,.6)
> shapiro.test(x)

    Shapiro-Wilk normality test

data:  x 
W = 0.8816, p-value = 0.0502

> x <- rlnorm(20,0,.4)
> shapiro.test(x)

    Shapiro-Wilk normality test

data:  x 
W = 0.9405, p-value = 0.2453

So, in both these cases (binomial and lognormal variates) the p-value is > 0.05 causing a failure to reject the null (that the data are normal). Does this mean we are to conclude that the data are normal? (hint: the answer is no). Failure to reject is not the same thing as accepting. This is hypothesis testing 101.

But what about larger sample sizes? Let's take the case where there the distribution is very nearly normal.

> library(nortest)
> x <- rt(500000,200)
> ad.test(x)

    Anderson-Darling normality test

data:  x 
A = 1.1003, p-value = 0.006975

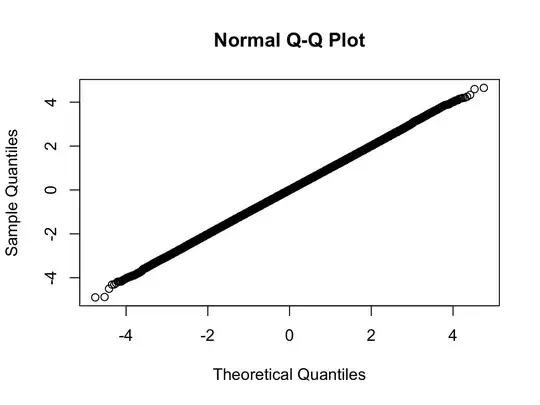
> qqnorm(x)
enter image description here enter image description here

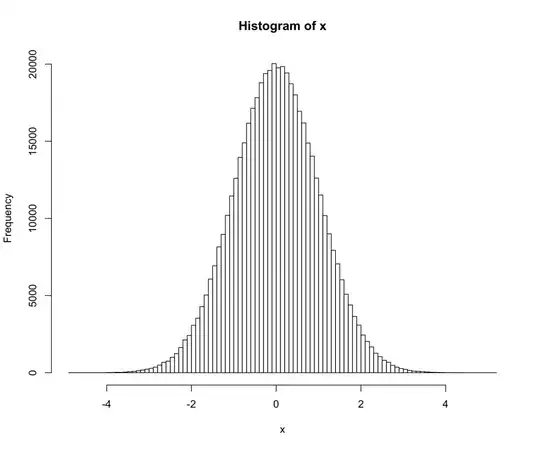
Here we are using a t-distribution with 200 degrees of freedom. The qq-plot shows the distribution is closer to normal than any distribution you are likely to see in the real world, but the test rejects normality with a very high degree of confidence.

Does the significant test against normality mean that we should not use normal theory statistics in this case? (another hint: the answer is no :) )

Sadegh
  • 865
  • 1
  • 23
  • 47
Ian Fellows
  • 17,228
  • 10
  • 49
  • 63
  • 10
    Very nice. The big follow-up question (which I have yet to find a satisfactory answer for, and would love to have a simple answer to give my students, but I doubt there is one) is: if one is using graphical diagnostics of a regression, how (**other** than fitting a model/following a procedure that is robust against a certain class of violation [e.g. robust models, generalized least squares,] and showing that its results do not differ interestingly) does one decide whether to worry about a particular type of violation? – Ben Bolker Oct 17 '11 at 01:59
  • 19
    For linear regression... 1. Don't worry much about normality. The CLT takes over quickly and if you have all but the smallest sample sizes and an even remotely reasonable looking histogram you are fine. 2. Worry about unequal variances (heteroskedasticity). I worry about this to the point of (almost) using HCCM tests by default. A scale location plot will give some idea of whether this is broken, but not always. Also, there is no a priori reason to assume equal variances in most cases. 3. Outliers. A cooks distance of > 1 is reasonable cause for concern. Those are my thoughts (FWIW). – Ian Fellows Oct 17 '11 at 05:02
  • 1
    @Ian-Fellows Is there any book or paper with a similar conclusion that your answer, so I can cite it? – Leosar May 14 '14 at 13:53
  • 3
    @IanFellows: you sure wrote a lot, but you didn't answer the OP's question. Is there a single function that returns TRUE or FALSE for whether data is normal or not? – stackoverflowuser2010 Nov 23 '14 at 21:42
  • 3
    I've read and re-read this posting several times. Is the writing clear? (Hint: the answer is "no"). I would like to get a simple answer to a simple question of whether or not data is normally distributed. Does this posting provide a solution? (Hint: the answer is "no"). – stackoverflowuser2010 Nov 23 '14 at 22:14
  • 5
    @stackoverflowuser2010, Here are two definitive answers to your simple question: (1) You can never, no matter how much data you collect, conclusively determine that it was generated from an exactly normal distribution. (2) Your data is not generated from an exactly normal distribution (no real data is). – Ian Fellows Nov 24 '14 at 18:50
  • @IanFellows: The question is not if a data set is generated from an exactly normal distribution. The question is if data is normally distributed, meaning that about 68% of values drawn from a normal distribution are within one standard deviation σ away from the mean, about 95% of the values lie within two standard deviations, etc. The fact that your answer provides a "textbook" answer means that you are a student and have never worked on real data or real-world scenarios. Please amend your answer to signify that fact. – stackoverflowuser2010 Nov 24 '14 at 18:55
  • 15
    @stackoverflowuser2010, that is adorable. I particularly like the personal shot. You may have wanted to try googling me before you took it though. – Ian Fellows Nov 24 '14 at 19:53
  • 3
    I wonder why you use the "Anderson-Darling" Test to show the insufficiency of those tests. How about the "Shapiro-Wilk" test? In how many cases are subjective test like the qq-plot used to accept truly non-normal distributed sample sets as normal distributed? – JFS Feb 12 '15 at 06:17
  • @IanFellows,then,what method can be used to judge normal distribution? – kittygirl Mar 26 '19 at 06:28
  • @IanFellows,cannot repeat `what about larger sample sizes?` example in python:`c=scipy.stats.t.rvs(200,size=500000) print(scipy.stats.anderson(c,'norm'))` – kittygirl Mar 26 '19 at 08:06
  • @IanFellows `Under what conditions are we interested in rejecting the null hypothesis that the data are normally distributed?` But rejecting the null tells us the data is not normally distributed. Isn't that a piece of information that can help us? – Quazi Irfan Apr 07 '19 at 10:56
25

I would also highly recommend the SnowsPenultimateNormalityTest in the TeachingDemos package. The documentation of the function is far more useful to you than the test itself, though. Read it thoroughly before using the test.

Brian Diggs
  • 57,757
  • 13
  • 166
  • 188
13

SnowsPenultimateNormalityTest certainly has its virtues, but you may also want to look at qqnorm.

X <- rlnorm(100)
qqnorm(X)
qqnorm(rnorm(100))
IRTFM
  • 258,963
  • 21
  • 364
  • 487
5

Consider using the function shapiro.test, which performs the Shapiro-Wilks test for normality. I've been happy with it.

Karl
  • 2,009
  • 15
  • 14
  • 4
    This is generally reserved for small samples (n < 50), but can be used with samples up to ~ 2000 - Which I would consider a relatively small sample size. – derelict Feb 17 '14 at 22:26
3
library(DnE)
x<-rnorm(1000,0,1)
is.norm(x,10,0.05)
ah bon
  • 9,293
  • 12
  • 65
  • 148
yuki
  • 31
  • 1
  • 4
    I don't want to be too negative, but (ignoring all of the larger-context answers here about why normality testing might be a bad idea), I'm worried about this package -- the tests it uses are undocumented. How does it differ from the tests in base R and in the `nortest` and `normtest` packages (Shapiro-Wilk, Anderson-Darling, Jarque-Bera, ...), all of which are very carefully characterized in the statistical literature? – Ben Bolker Nov 16 '14 at 12:56
  • having spent a few more seconds looking at the package, I think I can say it's pretty crude. It divides the data into bins and does a chi-squared test; while general, this approach is almost certainly less powerful than the better-known tests. – Ben Bolker Mar 14 '18 at 01:23
1

In addition to qqplots and the Shapiro-Wilk test, the following methods may be useful.

Qualitative:

  • histogram compared to the normal
  • cdf compared to the normal
  • ggdensity plot
  • ggqqplot

Quantitative:

The qualitive methods can be produced using the following in R:

library("ggpubr")
library("car")

h <- hist(data, breaks = 10, density = 10, col = "darkgray") 
xfit <- seq(min(data), max(data), length = 40) 
yfit <- dnorm(xfit, mean = mean(data), sd = sd(data)) 
yfit <- yfit * diff(h$mids[1:2]) * length(data) 
lines(xfit, yfit, col = "black", lwd = 2)

plot(ecdf(data), main="CDF")
lines(ecdf(rnorm(10000)),col="red")

ggdensity(data)

ggqqplot(data)

A word of caution - don't blindly apply tests. Having a solid understanding of stats will help you understand when to use which tests and the importance of assumptions in hypothesis testing.

cacti5
  • 2,006
  • 2
  • 25
  • 33
1

The Anderson-Darling test is also be useful.

library(nortest)
ad.test(data)
LeelaSella
  • 757
  • 3
  • 13
  • 24
0

when you perform a test, you ever have the probabilty to reject the null hypothesis when it is true.

See the nextt R code:

p=function(n){
  x=rnorm(n,0,1)
  s=shapiro.test(x)
  s$p.value
}

rep1=replicate(1000,p(5))
rep2=replicate(1000,p(100))
plot(density(rep1))
lines(density(rep2),col="blue")
abline(v=0.05,lty=3)

The graph shows that whether you have a sample size small or big a 5% of the times you have a chance to reject the null hypothesis when it s true (a Type-I error)

user5807327
  • 111
  • 1
  • 3