4
daList={{0.059, 0.298, 0.726, 0.735, 1.461, 2.311, 3.315}, 
        {0.05, 0.404,0.664, 0.782, 1.376, 2.328, 3.432}, 
        {0.087, 0.628, 0.986, 1.187,1.914, 3.481, 4.993}, 
        {0.073, 0.594, 0.975, 1.147, 2.019, 3.417,5.037}, 
        {0.143, 0.821, 1.442, 1.595, 2.983, 4.98, 7.604}, 
        {0.107,0.871, 1.431, 1.684, 2.964, 5.015, 7.394}}
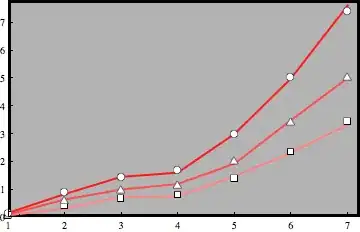

ListPlot[daList,
         Joined -> True,
         PlotRange -> {{1, 7}, {0, 7}}, 
         PlotStyle -> {{Thick, Lighter[Red, .5]}, 
                       {Dashed, Black}, 
                       {Thick,Lighter[Red, .3]}, 
                       {Dashed, Black}, 
                       {Thick,Lighter[Red, .1]}, 
                       {Dashed, Black}},
         Prolog ->{GrayLevel[0.5], EdgeForm[Thickness[.005]], 
                   Rectangle[{1.01, 0.01}, {6.99, 6.99}]}]

enter image description here

As you can see, I need to assign different directive to each line.

I would like the Dashed Black Line to be Points (Joined->False).

I can`t grasp the methods to group directive for sublist yet.

Thank You for your attention.

500
  • 6,509
  • 8
  • 46
  • 80
  • I read this twice, but I am still having trouble picturing it. Is it possibly for you to paint a picture of what you want? – Mr.Wizard Oct 15 '11 at 16:19
  • Thanks, and sorry; It's probably clear, but I am not thinking well. – Mr.Wizard Oct 15 '11 at 16:26
  • Better ? I removed the Frame Ticks, i will ask this part separately. Essentially i am looking to tighten the code, along with having points for one sublist out of 2 ! – 500 Oct 15 '11 at 16:30
  • Okay, so the picture above is correct, you just want a cleaner method? Actually, no, I am still not understanding: "along with having points for one sublist out of 2." Maybe I'm just useless today. :-) – Mr.Wizard Oct 15 '11 at 16:37
  • I think Heike understood what I failed to. Is there anything missing from her reply? – Mr.Wizard Oct 15 '11 at 16:42
  • @Mr.Wizard, Track records would always argue my questions are not clear :-) I hope to have just 2 type of directive, So daList has 5 sublist. 1,3,5 could have similar directive (Thick Lines with a list of colors) and 2,4,6 (Points with adjustable size and color). – 500 Oct 15 '11 at 17:01

3 Answers3

6

If you want every other plot to be joined, you could just set Joined->{True, False}, e.g.

ListPlot[daList, Joined -> {True, False}, 
 PlotRange -> {{1, 7}, {0, 7}}, 
 PlotStyle -> {{Thick, Lighter[Red, .5]}, {Dashed, Black}, {Thick, 
    Lighter[Red, .3]}, {Dashed, Black}, {Thick, 
    Lighter[Red, .1]}, {Dashed, Black}}, 
 Prolog -> {GrayLevel[0.5], EdgeForm[Thickness[.005]], 
   Rectangle[{1.01, 0.01}, {6.99, 6.99}]}]

which produces

joined/not joined

Edit

Concerning your comment, I guess you could always plot the even and odd sets of points separately and combine them with show. So for your example:

joinedStyle = {Thick, Lighter[Red, #]} & /@ {.5, .3, .1};
pointStyle = Black;

plot1 = ListPlot[daList[[1 ;; ;; 2]], Joined -> True, PlotStyle -> joinedStyle,
  PlotRange -> {{1,7},{0,7}}];
plot2 = ListPlot[daList[[2 ;; ;; 2]], Joined -> False, PlotStyle -> pointStyle];
Show[plot1, plot2, PlotRange -> {{1, 7}, {0, 7}}, 
  Prolog -> {GrayLevel[0.5], EdgeForm[Thickness[.005]], 
    Rectangle[{1.01, 0.01}, {6.99, 6.99}]}]
Heike
  • 24,102
  • 2
  • 31
  • 45
  • Thank You ! the problem is i have actually 10*2 curve to plot. I was hoping to have only 2 sets of Directive One for the odd position in the list (Thick Line with Colors going lighter) and one for the even (Black)envisioned some directive for the subsist with odd number. Do you see a mean to that ? – 500 Oct 15 '11 at 16:58
4

You may consider constructing your plots separately, and layering them with Show. Here is an example that hopefully is not too far from the mark.

{d1, d2} = Partition[daList, 2]\[Transpose];
lambda = {541, 550, 560, 570, 580, 590, 600};
colors = {Thick, Red~Lighter~#} & /@ {0.5, 0.3, 0.1};

g1 = ListPlot[d1, Joined -> True, PlotStyle -> colors];
g2 = ListPlot[d2, PlotStyle -> {{Black, AbsolutePointSize[5]}}];

Show[{g1, g2}, PlotRange -> {{1, 7}, {0, 7}}, 
 AspectRatio -> 1/GoldenRatio, Frame -> True, FrameStyle -> 20, 
 FrameTicks -> {{Automatic, 
    None}, {MapIndexed[{#2[[1]], #} &, lambda], Automatic}}, 
 Prolog -> {GrayLevel[0.5], EdgeForm[Thickness[.005]], 
   Rectangle[Scaled[{0, 0}], Scaled[{1, 1}]]}, ImageSize -> 600]

I think I am almost copying Heike here, but it is not intentional. Hopefully both answers add something.

There is a more complete example of the use of Scaled and ImageScaled for this very application in: https://stackoverflow.com/questions/6303500/mathematica-matlab-like-figure-plot

Community
  • 1
  • 1
Mr.Wizard
  • 24,179
  • 5
  • 44
  • 125
  • So Neat ! Thank you, any advise to make that gray box perfectly fitting the plot :-)? – 500 Oct 15 '11 at 17:12
  • @500 do you mean a different appearance than it has now, or automatically fitted to PlotRange, so it looks the same for other sizes? – Mr.Wizard Oct 15 '11 at 17:23
  • Automatically fit plot range would be ideal ! – 500 Oct 15 '11 at 17:25
  • And a little explanation on this elegant syntax : Red~Lighter~# & /@ {0.5, 0.3, 0.1} on the use of ~ would be awesome :-) And by the way you solved a question I was about to ask on AspectRatio ! – 500 Oct 15 '11 at 17:29
  • @500 you can you `Scaled` to fit the range (see edit). `Red~Lighter~#` is just infix notation for `Lighter[Red, #]`. I think you know the rest. Seeing as you are going to have many more than three lines, you probably want something like `Table[{Thick, Lighter[Red, i]}, {i, 0.5, 0, 0.5 / Length@d1}]` for `colors` in the end. – Mr.Wizard Oct 15 '11 at 17:35
  • Wizard, thank You. I must say "Scaled" confuse me. I don`t know to what I should scale the rectangle to in your solution. And i am not sure it will make the black Edge uniform. i.e. does scaling the rectangle scales including the edge ? – 500 Oct 15 '11 at 17:40
  • @500 I am having a bad day for understanding. I think what you are asking is what are the bounds to which `{0,0}` and `{1,1}` are scaled. If that is the case, it is the same as `PlotRange` I believe. If you need to include the entire graphic (such as tick labels, etc.) then you may use `ImageScaled` in place of `Scaled`. – Mr.Wizard Oct 15 '11 at 17:48
  • 1
    @Mr.Wizard: given that my edit came after your post, I think I'm unintentionally copying you instead of the other way around. I was reacting to 500's comment and had completely missed your answer. – Heike Oct 15 '11 at 17:56
  • @Mr.Wizard, Thank You, I think the problem is I don`t understand Scaled :-) Thus,asking about it is tricky. – 500 Oct 15 '11 at 18:12
  • @belisarius apparently I am, but don't call me sugar. – Mr.Wizard Oct 15 '11 at 19:22
  • @belisarius, loool sorry "@Mr Wizzard, sweet" ;-) – 500 Oct 16 '11 at 02:57
3

As an alternative to ListPlot, you could consider Graphics

tdata = MapIndexed[{#2[[1]], #1} &, #] & /@ daList;

and

Graphics[
 { GrayLevel[0.7], EdgeForm[AbsoluteThickness[2]], 
  Rectangle[{1.02, 0.05}, {7.2, 7.75}],
  (*lines*)
  AbsoluteThickness[2], 
  Transpose[{Lighter[Red, #] & /@ {0.5, 0.3, 0.1}, 
    Line@tdata[[#]] & /@ {1, 3, 5}}],
  (*points*)
  Black, PointSize[0.016],
  Point@tdata[[#]] & /@ {2, 4, 6}
  }, Axes -> True, PlotRange -> {{1, 7.2}, {0, 7.8}},
 AspectRatio -> 1/GoldenRatio]

gives

enter image description here

or, to give each data set a different symbol,as in the following plot:

enter image description here

Code:

Graphics[
 { GrayLevel[.7], EdgeForm[AbsoluteThickness[2]], 
  Rectangle[{1.02, 0.05}, {7.2, 7.75}],

  (*lines*)
  AbsoluteThickness[2], 
  Transpose[{Lighter[Red, #] & /@ {0.5, 0.3, 0.1}, 
    Line@tdata[[#]] & /@ {1, 3, 5}}],

  (*points*)

  Inset[Graphics[{EdgeForm[Black], White, Rectangle[]}, 
      ImageSize -> 8], #] & /@ tdata[[2]],
  Inset[Graphics[{EdgeForm[Black], White, 
       Polygon[{{1, 0}, {0, Sqrt[3]}, {-1, 0}}]}, 
      ImageSize -> 10], #] & /@ tdata[[4]],
  Inset[Graphics[{ EdgeForm[Black], White, Disk[]}, 
      ImageSize -> 9], #] & /@ tdata[[6]]

  }, Axes -> True, PlotRange -> {{1, 7.2}, {0, 7.8}},
 AspectRatio -> 1/GoldenRatio]
681234
  • 4,214
  • 2
  • 35
  • 42