4

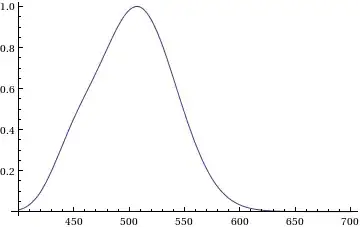
Please consider the following distribution :

rs={{400, 0.00929}, {410, 0.0348}, {420, 0.0966}, {430, 0.2}, {440, 0.328}, {450, 0.455}, 
    {460, 0.567}, {470, 0.676}, {480, 0.793}, {490, 0.904}, {500, 0.982}, {510, 0.997}, 
    {520,0.935}, {530, 0.811}, {540, 0.65}, {550, 0.481}, {560, 0.329}, {570,0.208}, 
    {580, 0.121}, {590, 0.0655}, {600, 0.0332}, {610, 0.0159}, {620, 0.00737}, 
    {630, 0.00334}, {640, 0.0015}, {650,0.000677}, {660, 0.000313}, {670, 0.000148}, 
    {680, 0.0000715}, {690,0.0000353}, {700, 0.0000178}}

enter image description here

How could I interpolate this distribution to obtain value for points at any location on the X Axis ?

500
  • 6,509
  • 8
  • 46
  • 80

3 Answers3

7

Just use the standard Interpolation function:

rsInterpolation = Interpolation@rs;
Plot[rsInterpolation@x, {x, 400, 700}]

Result

If you want to fit a specific class of functions (such as a normal distribution), instead use FindFit.

Mechanical snail
  • 29,755
  • 14
  • 88
  • 113
  • 1
    @500 Please be aware that Interpolation[] obviously could not work as expected as an extrapolation. Try Plot[Interpolation[rs]@x, {x, 1, 1000}] to see this. It is not a flaw of this answer! – Dr. belisarius Oct 10 '11 at 20:08
  • Great! Comment removed, and +1 – Leonid Shifrin Oct 10 '11 at 21:10
  • @belisarius lol your plot is terrifying. This is how I am using it, seems to work : rsi =Interpolation[Transpose@{Range[400, 700, 10], Flatten@rodSensitivity}] rsi /@ Range[#,#+30,1] & /@ {440, 490, 540} – 500 Oct 10 '11 at 21:36
  • @LeonidShifrin Just out of curiosity, what was your commment? – abcd Oct 10 '11 at 21:39
  • @yoda: he pointed out that what I had written would be slow since I forgot to `Evaluate` explicitly inside a `Plot`. – Mechanical snail Oct 10 '11 at 21:40
  • 3
    @Mechanicalsnail I don't think a fit with a normal distribution will be necessary here. This looks like the sensitivity curve of the human eye (x-axis is wavelength in nm). – Sjoerd C. de Vries Oct 10 '11 at 22:03
  • 3
    @LeonidShifrin Hmm. I believe the imps of recursion are at work today. Comment: Remove this comment: remove this... – Daniel Lichtblau Oct 10 '11 at 22:50
  • 1
    FixedPoint[@Daniel's Comment[#]& , [`x`](http://stackoverflow.com/questions/7717665/interpolation-in-mathematica)] – Dr. belisarius Oct 11 '11 at 15:45
5

If you need nice derivatives, you may do something like:

interp = Interpolation[rs, InterpolationOrder -> 3, Method -> "Spline"]
Show[Plot[{interp[x], 10 interp'[x]}, {x, Min[First /@ rs], Max[First /@ rs]},
          PlotRange -> Full],
     ListPlot@rs]

enter image description here

Look at the difference in the derivative's behavior when you use the "Spline" Method:

interp  = Interpolation[rs, InterpolationOrder -> 3, Method -> "Spline"]
interp1 = Interpolation[rs, InterpolationOrder -> 3]
Show[Plot[{interp1'[x], interp'[x] - .005}, 
          {x, Min[First /@ rs], Max[First /@ rs]}, PlotRange -> Full]]

enter image description here

Dr. belisarius
  • 60,527
  • 15
  • 115
  • 190
0

If it is a distribution, I think you should use SmoothKernelDistribution instead.

carlosayam
  • 1,396
  • 1
  • 10
  • 15