I want to do a boxplot in ggpubr, with an added jitter. Unfortunately, it jitters on the y-axis, which really is confusing for the viewer.
Setup:
library(ggpubr)

df <- tibble(
  group = rep(c("Group1", "Group2", "Group3"), each = 10),
  value = sample(0:3, 30, replace = TRUE) # 300 samples with replacement
)
Code for two graphs:
ggboxplot(df, x = "group", y = "value", add = "jitter", color = "group", palette = "jco") +
  rremove("x.text") +
  rremove("xlab") +
  rotate_x_text(angle = 45)

ggboxplot(df, x = "group", y = "value", add = "dotplot", color = "group", palette = "jco") +
  rremove("x.text") +
  rremove("xlab") +
  rotate_x_text(angle = 45)
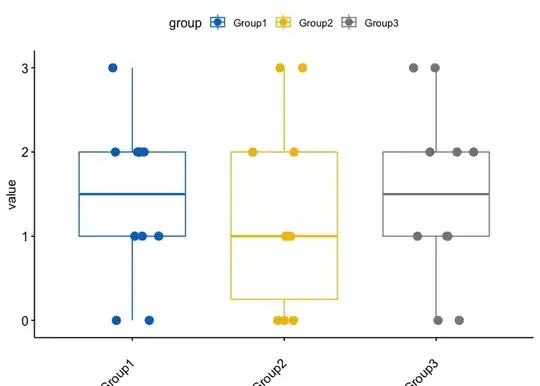
The jitter graph (with jitter on both x and y axes)

The dotplot graph (with the position reflecting the real Y-axis values)

How do I get ggpubr to only jitter on the x-axis, not on the y-axis?