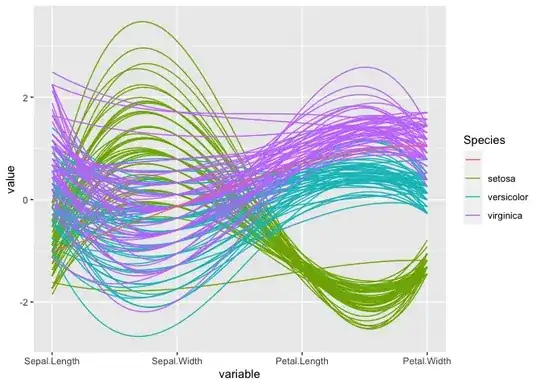
In the following code used to plot the parallel coordinates (reference), I want to display only limited numbers of the legend for the column "5". I use column 5 to group in the plot. Column 5 have multiple unique values, when I plot, all the values gets printed as legends (see attached screenshot).
Is there a way I could modify following code to display only few values in legend? For example in the plot I want to discard values >=410.
suppressPackageStartupMessages(library(dplyr))
suppressPackageStartupMessages(library(viridis))
suppressPackageStartupMessages(library(ggplot2))
suppressPackageStartupMessages(library(ggthemes))
suppressPackageStartupMessages(library(hrbrthemes))
suppressPackageStartupMessages(library(GGally))
suppressPackageStartupMessages(library(gridExtra))

plt2<-suppressWarnings(print(ggparcoord(data,
    columns = c(1,2,3, 4),
    groupColumn = 5,splineFactor = 20, #order = "skewness",#splineFactor = TRUE, order = "skewness",
    scale="globalminmax",
    showPoints = TRUE, title = "All Fts.",
    alphaLines = 0.5) )) +#+ scale_color_viridis(discrete=TRUE)
  theme_economist_white(base_family="Arial Narrow", gray_bg = FALSE)+
  scale_colour_economist()+
  theme(axis.line = element_line(color='black'), #legend.position = "none",
    plot.background = element_blank(),
    panel.grid.major = element_blank(),
    panel.grid.minor = element_blank(),
    panel.border = element_blank())+scale_x_discrete(limit=c('Min Rows', 'Max Depth', 'MTries','AUC'))+
  guides(colour = guide_legend(override.aes = list(alpha = 5)))
#+scale_colour_manual(limits = c("10", "60", "110", "160", "210", "260", "310", "360","410"))