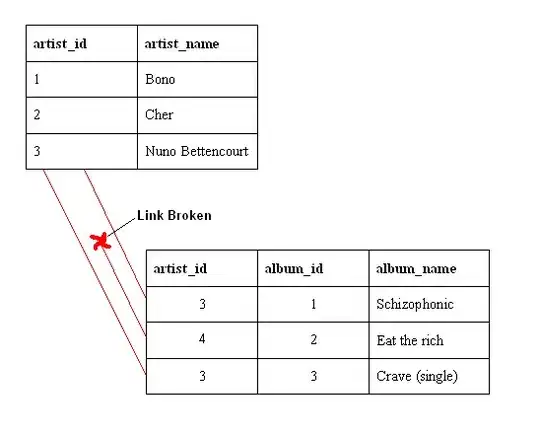
I would like to create a sankey chart, based on a google sheets entry. In the google sheet, you will find a column with the source, another one with the destination and the third column shows the value.
Thats a screenshot of the Spreadsheet:
I wrote a script to create a sankey diagram showing the dependicies from source to destination.
In the sankey diagram, you several nodes (a coloized bar). The script for the sankey diagram are shown here:
code.gs
function onOpen() {
    SpreadsheetApp.getUi() // Or DocumentApp or FormApp.
        .createMenu('Zusatzfunktionen')
        .addItem('SankeyDiagram', 'openDialog')
        .addToUi();
}

function getSpreadsheetData() {
    // ID of your Document, take from URL
    var ssID = "",
        // which Sheet? [0] is the first and so on...
        sheet = SpreadsheetApp.openById(ssID).getSheets()[0],
        data = sheet.getDataRange().getValues();
    return data;
}

function openDialog() {
    var html = HtmlService.createHtmlOutputFromFile('index')
        .setHeight(300)
        .setWidth(1000);
    SpreadsheetApp.getUi() // Or DocumentApp or FormApp.
        .showModalDialog(html, 'Sankey Diagram');
}
index.html:
<!DOCTYPE html>
<html>
   <head>
      <base target="_top">
      <script src="https://www.google.com/jsapi"></script>
   </head>
   <body>
      <div id="main"></div>
      <script type="text/javascript">
         google.load('visualization', '1', {
           packages: ['corechart', 'sankey']
         });      google.setOnLoadCallback(initialize);

           function initialize() {
            google.script.run.withSuccessHandler(drawChart).getSpreadsheetData();
           }

           function drawChart(rows) {
             console.log(rows);
             var data = google.visualization.arrayToDataTable(rows);
             var chart = new google.visualization.Sankey(document.getElementById('main'));
             chart.draw(data, {width: 900, sankey: {iterations: 64}});
           }
      </script>
   </body>
</html>
Here you can find a screenshot of the sankey diagramm, created by the script shown above.
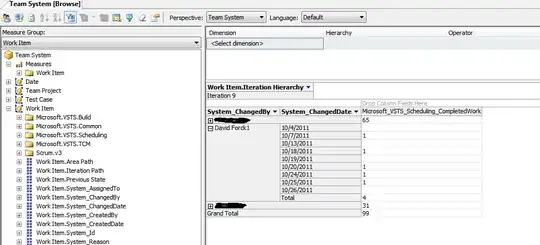
In the second step, i would like to add additional information at each node in the sankey diagram. My goal is to add the percentage of each each node. The picture shows my favored solution.
How can i modify my script to calculate the percentage share of each node related to the total value of column 3 in the spreadsheet?