0

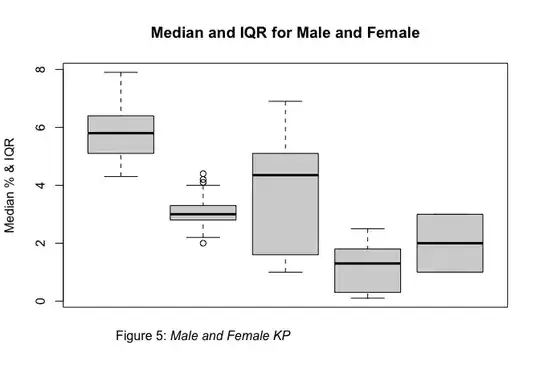
Sorry about the basic nature of the question. For APA guidelines, I need to italicize the label after the words Figure 5. I'd appreciate it if someone could address this in the following way where the italics command goes, so that only the male and female KP are italicized. Thank you

boxplot(KP, xlab = "Figure 5: Male and Female KP", 
        ylab = "Median % & IQR", main = "Median and IQR for Male and Female", 
        ylim = c(50,100))

I tried numerous commands within the code above but was going around in circles

UseR10085
  • 7,120
  • 3
  • 24
  • 54

2 Answers2

0

You can use mtext() with coordinates at. Here is an example code using the iris dataset with your labels:

data(iris)
boxplot(iris, ylab = "Median % & IQR", main = "Median and IQR for Male and Female",xaxt='n')
mtext(side=1,line=1.5, text="Figure 5:",at=2) #'at' argument takes position on the x axis
mtext(side=1,line=1.5, text="Male and Female KP",at=3.35,font=3) # you can adjust the position of label according to your plot.

enter image description here

Nitesh Shriwash
  • 128
  • 1
  • 6
0

Another option could be using substitute by pasting partially italics in one mtext call. You could use the following code (data from @Nitesh):

data(iris)
boxplot(iris, ylab = "Median % & IQR", main = "Median and IQR for Male and Female",xaxt='n')
mtext(side = 1, line = 1.5, text = substitute(paste("Figure 5: ", italic('Male and Female KP'))), at = 2)

Created on 2023-08-06 with reprex v2.0.2

Quinten
  • 35,235
  • 5
  • 20
  • 53