1

Given a inhomogeneous cluster model, associated with a variable Z as an object of class 'im', how to convert the result of the number of mean points per cluster (Mean cluster size) in pixel image to the average number of individuals per cluster?

For example, in the inhomogeneous fitting cluster of Beilschmiedia data:

> fitBeiThom <- kppm(bei ~ elev + grad, "Thomas", data=bei.extra)
> fitBeiThom
Inhomogeneous cluster point process model
Fitted to point pattern dataset ‘bei’
Fitted by minimum contrast
    Summary statistic: inhomogeneous K-function

Log intensity:  ~elev + grad

Fitted trend coefficients:
(Intercept)        elev        grad 
-8.56355220  0.02143995  5.84646680 

Cluster model: Thomas process
Fitted cluster parameters:
       kappa        scale 
5.021718e-05 2.737983e+01 
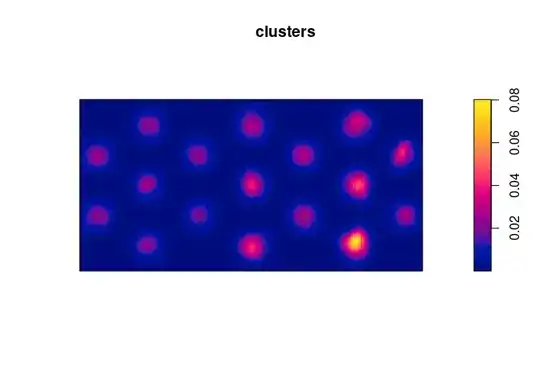
Mean cluster size:  [pixel image]

Cluster strength: phi =  2.114
Sibling probability: psib =  0.6789

In this context, what would be the exact value of the number of midpoints per cluster and how to obtain it?

Tieygons
  • 43
  • 5

2 Answers2

2

The size of a single cluster is not well-defined for an inhomogeneous cluster model. It depends on where in the window you place the parent point that generates the cluster. Below is an example generating a small hexagonal grid of cluster centers and the corresponding plot of (superimposed) clusters for your fitted model. In principle the contribution of a single cluster extends over the entire region in the Thomas model, but the tails decay exponentially fast, and with the given parameters and cluster centers in this example it will make no pracitally difference whether you consider them separately or superimposed.

library(spatstat)
fitBeiThom <- kppm(bei ~ elev + grad, "Thomas", data=bei.extra)
gridBei <- hexgrid(bei, s = 100)
clusters <- clusterfield(fitBeiThom, locations = gridBei)
plot(clusters)
integral(clusters)/npoints(gridBei)
#> [1] 142.8573
plot(clusters)

Ege Rubak
  • 4,347
  • 1
  • 10
  • 18
  • Thank you so much, Professor Rubak. I understood. – Tieygons Aug 07 '23 at 13:58
  • One more things. I noticed that the length of "s" affects the result of the mean number of points, how do I define the optimal length for a datasetmean? Or does it just work like the number of clusters in the simulation, so would it be more or less arbitrary? – Tieygons Aug 07 '23 at 19:22
2

As explained in Ege Rubak's answer, the expected cluster size (expected number of offspring of a given parent point) depends on the location of the parent point.

To compute the expected cluster size for a parent at a given location, say for a parent at the location x=100, y=200, do this:

Parent <- ppp(100, 200, window=Window(bei))
integral(clusterfield(fitBeiThom, locations=Parent))

which returns a single number.

To understand the range of possible results that you could get for different choices of the parent point, do

mu <- parameters(fitBeiThom)$mu
range(mu)
summary(mu)
 

and you could also plot the image mu.

For more explanation, see Chapter 12 of the spatstat book.

Adrian Baddeley
  • 2,534
  • 1
  • 5
  • 8