2

I have a rather peculiar problem in paneling with cowplot and exporting the result as a PDF file.

Consider the following MWE:

# Load libraries
library(consort)
library(cowplot)
library(ggplotify)

# Create data for flowchart A
participant_id <- 1:10
exclusion <- rep(NA, 10)
exclusion[1:3] <- "Lost to follow-up"
df <- data.frame(participant_id, exclusion)

# Create the flowchart A
flowchart_a <- consort_plot(data = df,
                            orders = c(participant_id = "Invited participants",
                                       exclusion = "Excluded",
                                       participant_id = "Completed the study"),
                            side_box = c("exclusion"),
                            cex = 0.9)
plot(flowchart_a)


# Destroy unneeded vectors
rm(participant_id, exclusion, df)

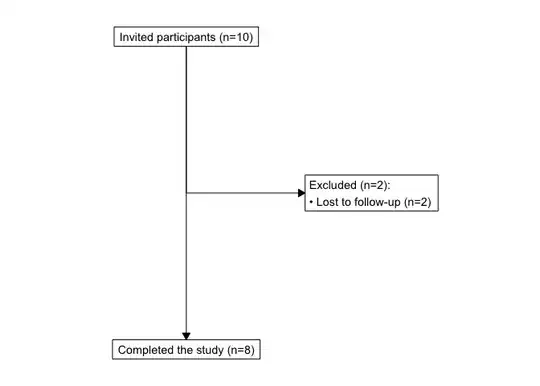
# Create data for flowchart B
participant_id <- 1:10
exclusion <- rep(NA, 10)
exclusion[1:2] <- "Lost to follow-up"
df <- data.frame(participant_id, exclusion)

# Create the flowchart B
flowchart_b <- consort_plot(data = df,
                            orders = c(participant_id = "Invited participants",
                                       exclusion = "Excluded",
                                       participant_id = "Completed the study"),
                            side_box = c("exclusion"),
                            cex = 0.9)
plot(flowchart_b)

Created on 2023-07-29 with reprex v2.0.2

# Destroy unneeded vectors
rm(participant_id, exclusion, df)

# Turn the consort_plot objects into graphical objects (= grobs) for paneling

grob1 <- as.grob(function() plot(flowchart_a))
grob2 <- as.grob(function() plot(flowchart_b))

# Create panel
grid <- plot_grid(grob1, NULL, grob2,
                  rel_heights = c(1, 0.3, 1),
                  labels = c("A", "", "B"),
                  ncol = 1)

# Save the panel to a PDF file
save_plot("panel.pdf", grid, nrow = 2, ncol = 1.5)

Finally, when creating a panel of these little graphs with cowplot and exporting it as a PDF, the bullets turn into ellipses (see image below). What is curious is that exporting to a PNG works without that problem.

enter image description here

jaggedjava
  • 440
  • 6
  • 14

2 Answers2

1

While your code does render the PDF with bullets on my machine (though outdated: see session info at the bottom), you could try replacing save_plot with ggsave of {ggplot2} like so:

ggsave(plot = grid, filename = "panel1.pdf", height = 10, width 7.5)

from {cowplot}'s documentation:

This function* behaves just like ggsave() from ggplot2. The main difference is that by default it doesn't use the Dingbats font for pdf output. The Dingbats font causes problems with some pdf readers.

* ggsave2, the base of save_plot


> sessionInfo()
R version 4.1.1 (2021-08-10)
Platform: x86_64-w64-mingw32/x64 (64-bit)
Running under: Windows 10 x64 (build 19045)

Matrix products: default
 
attached base packages:
[1] stats     graphics  grDevices utils     datasets  methods   base     

other attached packages:
[1] ggplotify_0.1.0 cowplot_1.1.1   consort_1.2.0  

loaded via a namespace (and not attached):
 [1] magrittr_2.0.3     tidyselect_1.2.0   munsell_0.5.0      colorspace_2.1-0  
 [5] R6_2.5.1           ragg_1.2.4         rlang_1.1.0        fansi_1.0.3       
 [9] dplyr_1.1.2        tools_4.1.1        grid_4.1.1         gtable_0.3.3      
[13] utf8_1.2.2         cli_3.6.1          withr_2.5.0        gridGraphics_0.5-1
[17] systemfonts_1.0.4  tibble_3.2.1       lifecycle_1.0.3    textshaping_0.3.6 
[21] farver_2.1.1       ggplot2_3.4.2      vctrs_0.6.1        yulab.utils_0.0.6 
[25] glue_1.6.2         labeling_0.4.2     compiler_4.1.1     pillar_1.9.0      
[29] generics_0.1.3     scales_1.2.1       pkgconfig_2.0.3  
I_O
  • 4,983
  • 2
  • 2
  • 15
  • Thanks for you input - however, the resulting PDF is identical even with ggsave(), i.e. the problem with the ellipses persists. – jaggedjava Jul 30 '23 at 09:02
  • 1
    However, due to your answer, an idea just popped up to my mind: why not export to an SVG file! I have now tried it and it seems to work perfect. I'll post an answer here below, while waiting for possible explanations by the community for why exporting to a PDF behaves strangely. – jaggedjava Jul 30 '23 at 09:11
0

Update:

While I haven't come up with a solution to my own question above, I'll post an obvious workaround solution here: why not export to an SVG file that can be easily converted to PDF later (if it's necessary at all).

As can be seen below, the bullets are retained in the resulting SVG file.

# Save the panel to an SVG file
save_plot("panel.svg", grid, nrow = 2, ncol = 1.5)

Created on 2023-07-30 with reprex v2.0.2

enter image description here

An alternative way would obviously be to use ggsave(), which produces seemingly the same result:

# Alternative way:
ggsave(plot = grid, filename = "panel1.svg", height = 10, width = 7.5)

Created on 2023-07-30 with reprex v2.0.2

jaggedjava
  • 440
  • 6
  • 14