-1

I have a problem to solve with the time series. My data set looks like:

Date;hours;result
2021-01-01;180;2.78
2021-01-01;196;2.68
2021-01-01;170;2.53
2021-01-01;181;2.71
2021-01-01;169;2.43
2021-01-01;201;2.89

What would be the best approach to estimate the number of hours for the next day, to achieve the highest result?

I was thinking about Random Walk for Times Series but i have no clue how can I force the algorith to combine all 3 factors. In all examples i found there is always prediction f(x).
mozway
  • 194,879
  • 13
  • 39
  • 75
  • What is the exact expected output? – mozway Jul 28 '23 at 13:24
  • Welcome to [so]. Please read [How To Ask a Good Question](https://stackoverflow.com/help/how-to-ask). "please help me" is [not a question](https://meta.stackoverflow.com/questions/284236/why-is-can-someone-help-me-not-an-actual-question); we don't write code to specification. [You are expected to study the problem](https://meta.stackoverflow.com/questions/261592/how-much-research-effort-is-expected-of-stack-overflow-users) ahead of time; think of logical steps to solve the problem; figure out exactly where you are stuck, and be able to show exact input and output. – itprorh66 Jul 28 '23 at 13:26
  • What do you mean by "estimate the number of hours for the next day to achieve the highest result"? You have a more or less linear relationship between hours and result (at least, with this little amount of data). If you want the maximum result, get the maximum number of hours available. If you want to estimate the number of hours the next day, and the result, then chain the estimates (day -> expected hours, expected hours -> results). – nonDucor Jul 28 '23 at 13:42

1 Answers1

0

The question is unclear, especially regarding the part on the next day.

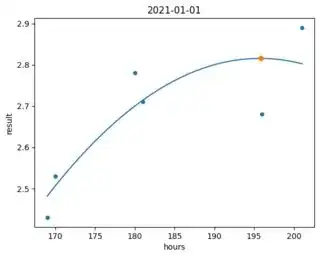
Assuming you want to find the hours needed to obtain the maximum result for the current day, using a polynomial regression:

import numpy as np

def hour_max(g, deg=2):
    p = np.polynomial.Polynomial.fit(df['hours'], df['result'], deg=deg)
    x, y = p.linspace()
    idx = y.argmax()
    return x[idx]

df.groupby('Date').apply(hour_max)

Output:

Date
2021-01-01    195.828283
dtype: float64

If you also want to have a visual:

def hour_max(g, deg=2, plot=False):
    p = np.polynomial.Polynomial.fit(df['hours'], df['result'], deg=deg)
    x, y = p.linspace()
    idx = y.argmax()
    
    if plot:
        ax = g.plot.scatter(x='hours', y='result')
        ax.plot(x, y)
        ax.plot(x[idx], y[idx], marker='o')
        ax.set_title(g.name)
    
    return x[idx]

df.groupby('Date').apply(hour_max, plot=True)

Output:

Date
2021-01-01    195.828283
dtype: float64

Image:

polynomial regression

mozway
  • 194,879
  • 13
  • 39
  • 75