0

I want to add custom tickmarks to the following plt.imshow() plot (see below):

import numpy as np
import matplotlib.pyplot as plt

zmm = np.linspace(0,121,121).reshape(11,11)
plt.imshow(zmm, cmap = 'Blues')
plt.show()

figure 1

I tried to add the custom tickmarks that I need with:

xticks = np.linspace(6.5,7.5,6)
yticks = np.linspace(.14,.18,6)

plt.imshow(zmm, cmap = 'Blues')
plt.xticks(xticks)
plt.show()

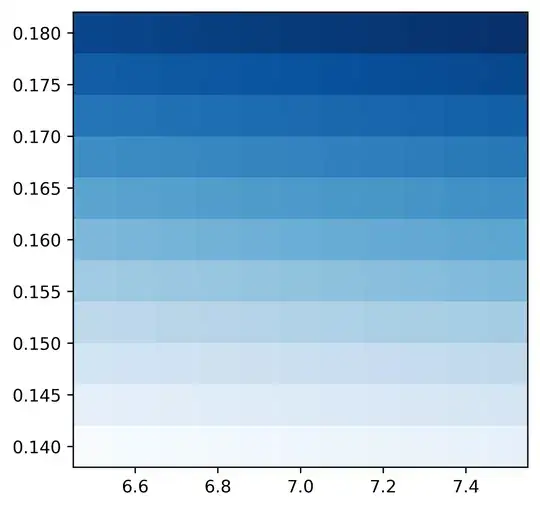
The figure below shows the outcome (trying for both x and yticks conveys even worse results). I could not solve that with this reference.

figure 2

jared
  • 4,165
  • 1
  • 8
  • 31

2 Answers2

2

IIUC you want to relabel the ticks (0..10) with the values of xticks and yticks. It's important to know the difference between a tick (the position) and a label (the text). See the doc.

In your case, the ticks will stay at the same position, while only the labels will change:

import numpy as np
import matplotlib.pyplot as plt

zmm = np.linspace(0,121,121).reshape(11,11)
plt.imshow(zmm, cmap = 'Blues')

nb_ticks = 6

xticks = np.linspace(6.5, 7.5, nb_ticks)
yticks = np.linspace(.14, .18, nb_ticks)

new_xticks = np.linspace(0, 10, nb_ticks)
new_yticks = np.linspace(0, 10, nb_ticks)

plt.xticks(new_xticks, labels=xticks)
plt.yticks(new_yticks, labels=yticks)

plt.show()

Output:

enter image description here

Tranbi
  • 11,407
  • 6
  • 16
  • 33
1

Alternatively, if this is not actually an image, you might want to consider using pcolormesh, which takes x and y values, which are used to determine the ticks. imshow uses ticks corresponding to the indices in the array (which pcolormesh also does if you don't pass the x and y points). To make your code work, I changed the number of points in xticks and yticks since there needs to be a one-to-one correspondence for the number of ticks and the rows/columns (depending on x or y).

Also, note that pcolormesh doesn't default to square plots like imshow, hence the added line to make it square.

import numpy as np
import matplotlib.pyplot as plt

xticks = np.linspace(6.5, 7.5, 11)
yticks = np.linspace(0.14, 0.18, 11)

zmm = np.linspace(0, 121, 121).reshape(11, 11)
plt.pcolormesh(xticks, yticks, zmm, cmap='Blues')
plt.gca().set_box_aspect(1)
plt.show()

You'll also note that pcolormesh places the origin in the bottom left (like a typical graph) rather than in the top left, which imshow does.

jared
  • 4,165
  • 1
  • 8
  • 31