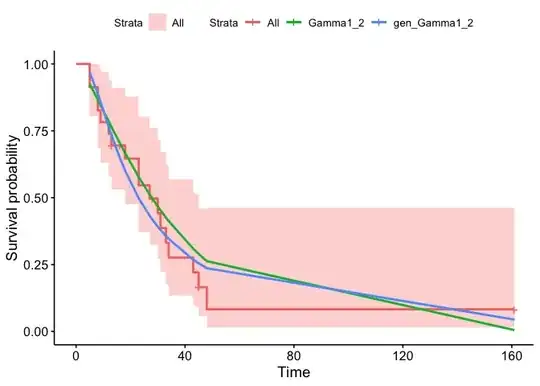
Looking at the source code for ggsurvplot, you can extract the flexsurv models' fitted data then add the lines to your kap meier plot, e.g.
library(tidyverse)
library(survival)
library(survminer)
#> Loading required package: ggpubr
#>
#> Attaching package: 'survminer'
#> The following object is masked from 'package:survival':
#>
#>     myeloma
# install.packages("flexsurv")
library(flexsurv)
data(cancer)

survobj1_2 <- Surv(aml$time, aml$status)
KMsufit1_2 <- survfit(survobj1_2 ~ 1, aml)
Gamma1_2 <- flexsurvreg(survobj1_2 ~ 1, data = aml, dist = 'gamma')
gen_Gamma1_2 <- flexsurvreg(survobj1_2 ~ 1, data = aml, dist = 'gengamma')

p1 <- ggsurvplot(KMsufit1_2, data = aml)$plot

summ <- survminer:::.get_data(Gamma1_2, data = aml)
summ_p2 <- left_join(summ, survminer:::.summary_flexsurv(Gamma1_2, type = c("cumhaz")))

summ <- survminer:::.get_data(gen_Gamma1_2, data = aml)
summ_p3 <- left_join(summ, survminer:::.summary_flexsurv(gen_Gamma1_2, type = c("cumhaz")))


p1 +
  geom_line(aes(time, est, color = "Gamma1_2"),
            data = summ_p2, size = 1) +
  geom_line(aes(time, est, color = "gen_Gamma1_2"),
            data = summ_p3, size = 1)

Created on 2023-07-20 with reprex v2.0.2
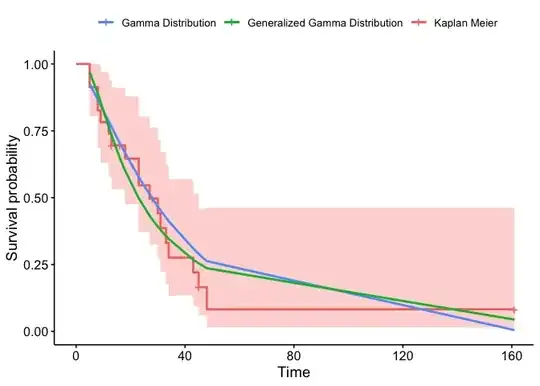
With different legend labels:
library(tidyverse)
library(survival)
library(survminer)
# install.packages("flexsurv")
library(flexsurv)
data(cancer)

survobj1_2 <- Surv(aml$time, aml$status)
KMsufit1_2 <- survfit(survobj1_2 ~ 1, aml)
Gamma1_2 <- flexsurvreg(survobj1_2 ~ 1, data = aml, dist = 'gamma')
gen_Gamma1_2 <- flexsurvreg(survobj1_2 ~ 1, data = aml, dist = 'gengamma')

p1 <- ggsurvplot(KMsufit1_2, data = aml, legend.labs = "Kaplan Meier")$plot +
  theme(legend.title = element_blank())

summ <- survminer:::.get_data(Gamma1_2, data = aml)
summ_p2 <- left_join(summ, survminer:::.summary_flexsurv(Gamma1_2, type = c("cumhaz")))

summ <- survminer:::.get_data(gen_Gamma1_2, data = aml)
summ_p3 <- left_join(summ, survminer:::.summary_flexsurv(gen_Gamma1_2, type = c("cumhaz")))

p1 +
  geom_line(aes(time, est, color = "Gamma Distribution"),
            data = summ_p2, size = 1) +
  geom_line(aes(time, est, color = "Generalized Gamma Distribution"),
            data = summ_p3, size = 1) +
  guides(fill = "none") +
  scale_color_hue(direction = -1)

Created on 2023-07-20 with reprex v2.0.2

