The exact format of your data is important here, which is why we try to encourage a reproducible example. However, it sounds as though your data is in the following format:
set.seed(1)

df <- data.frame(Person = 1:10,
                 Timepoint1 = rnorm(10, 1),
                 Timepoint2 = rnorm(10, 2),
                 Timepoint3 = rnorm(10, 1.5))

df
#>    Person Timepoint1 Timepoint2  Timepoint3
#> 1       1  0.3735462  3.5117812  2.41897737
#> 2       2  1.1836433  2.3898432  2.28213630
#> 3       3  0.1643714  1.3787594  1.57456498
#> 4       4  2.5952808 -0.2146999 -0.48935170
#> 5       5  1.3295078  3.1249309  2.11982575
#> 6       6  0.1795316  1.9550664  1.44387126
#> 7       7  1.4874291  1.9838097  1.34420449
#> 8       8  1.7383247  2.9438362  0.02924762
#> 9       9  1.5757814  2.8212212  1.02184994
#> 10     10  0.6946116  2.5939013  1.91794156
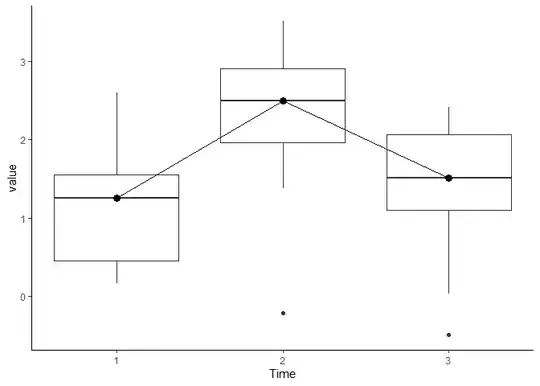
If this is the case, then we can pivot to long format, convert the timepoints to numbers using a regular expression (this is the bit that might trip you up if your data has different names from this example data), and plot using ggplot:
library(tidyverse)

df %>%
  pivot_longer(-Person, names_to = "Time") %>%
  mutate(Time = as.numeric(gsub("^Timepoint(\\d+)$", "\\1", Time))) %>%
  ggplot(aes(Time, value)) +
  geom_boxplot(aes(group = Time)) +
  stat_summary(geom = "line", fun = median) +
  stat_summary(geom = "point", fun = median, size = 3) +
  theme_classic()
Created on 2023-07-19 with reprex v2.0.2
