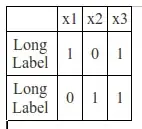
I want to display text on the right side of google graph timeline like

Is possible to show text with an ajax call taking the order number on the left side ?
      google.charts.setOnLoadCallback(drawChart);
      function drawChart() {
          var arrrows= JSON.parse(jsongant);
          var container = document.getElementById('timeline');
          var chart = new google.visualization.Timeline(container);
          var dataTable = new google.visualization.DataTable();

          container.style.display = null;

          dataTable.addColumn({ type: 'string', id: 'Ordername' });
          dataTable.addColumn({ type: 'string', id: 'Name' });
          dataTable.addColumn({ type: 'date', id: 'Start' });
          dataTable.addColumn({ type: 'date', id: 'End' });

          for(var i=0; i<arrrows.length; i++){
              var numeroordine=arrrows[i].ordername;
              var stato=arrrows[i].stato;
              var datainiziale=arrrows[i].datainiziale;
              var datafinale=arrrows[i].datafinalestato;
              dataTable.addRows([
                  [ numeroordine, stato, new Date(arrdatainiziale[0], arrdatainiziale[1]-1, arrdatainiziale[2]), new Date(arrdatafinale[0], arrdatafinale[1]-1, arrdatafinale[2]) ]]
                      );
          }

          chart.draw(dataTable, options);
          $('#timeline div div div svg g:first text').attr({'x':5,"text-anchor":"start"});

      }