I'm the author of the package, and I have to disappoint you: top_taxa only returns the top N taxa by some metric. This is by design: a plot with too many taxa in it simply becomes unintelligible, and tight control over the number of taxa is therefore required.
Luckily, you can apply your own manual filtering and use fantaxtic::collapse_taxa to then create a phyloseq object where all taxa <2% are merged. See the code below for a full example.
Note: you need to decide how 2% is calculated: is this a minimum abundance of 2%, a mean abundance of 2%, a summed abundance of 2%, etc. In the example below I used the maximum, and set the cutoff to 10% to prevent overplotting.
In the future, feel free to create an issue in the fantaxtic repository on GitHub; this will ensure that I can quickly and accurately answer your question.
require("phyloseq")
require("tidyverse")
require("fantaxtic")
# Load data
data(GlobalPatterns)
# Subset to max >10%
ps_genus <- tax_glom(GlobalPatterns, taxrank = "Genus", NArm = FALSE)
rel_abun <- transform_sample_counts(ps_genus, function(x) x / sum(x) )
pass <- filter_taxa(rel_abun, function(x) max(x) > 0.1, FALSE)
ids <- names(pass)[pass]
ps_genus_filtered <- collapse_taxa(ps_genus, taxa_to_keep = ids)
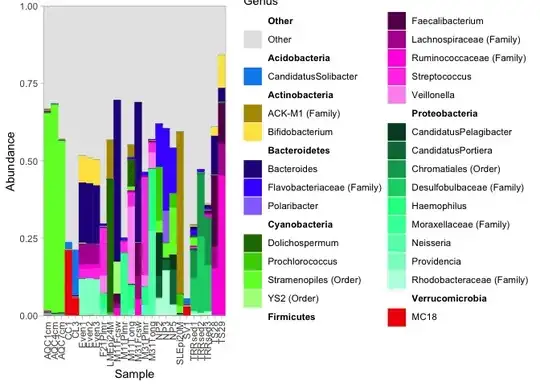
# Plot
plot_nested_bar(ps_genus_filtered, top_level = "Phylum", nested_level = "Genus")
Created on 2023-07-12 by the reprex package (v2.0.1)