The code is:
library(gginnards)
library(ggpmisc)
library(ggplot2)

set.seed(4321)
x <- 1:100
y <- rnorm(length(x), mean = 10)
my.data <- data.frame(x, y)

ggplot(my.data, aes(x, y)) +
  geom_quadrant_lines(colour = "blue", xintercept = 50, yintercept = 10) +
  stat_quadrant_counts(colour = "blue", xintercept = 50, yintercept = 10) +
  geom_point() +
  scale_y_continuous(expand = expansion(mult = 0.15, add = 0))
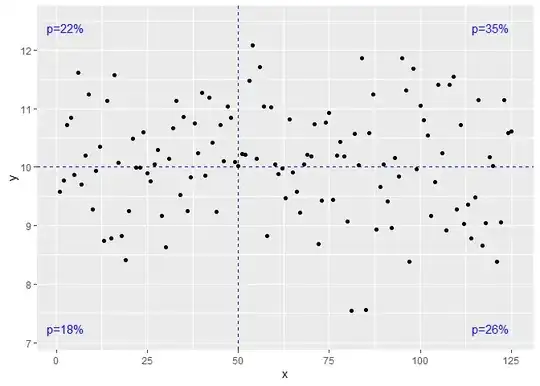
The plot was shown as below:

I'd like to know how to change the label from n=31, n=27, n=22, n=20 to p=31%, p=27%, p=22%, p=20%.
Also how to move n=27 and n=22 to the left a little bit without changing the position of n=31 and n=20? Thanks!