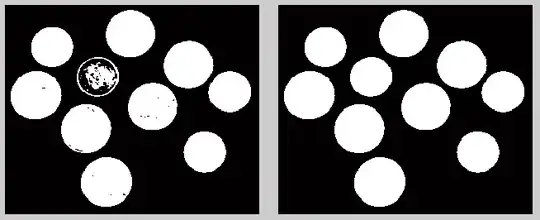
I have a list of data . My values in the list are 0<x<1 and length of the list is 1,000,000 . I need to plot a probability density function like this :
I have tried the plt.hist but it gives me weird numbers in y axis. like 80,000 which is frequency .
