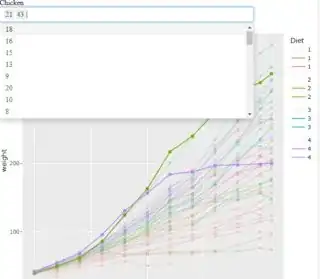
ggiraph creates much less issues converting a ggplot2 graphic to an interactive htmlwidget compared to plotly::ggplotly(). However, there is one key feature of plotly which I am missing in ggiraph: Selecting points by name in a selection box (via argument selectize in plotly::highlight())
library(plotly)
data("ChickWeight")
cw <- highlight_key(ChickWeight, ~Chick, group = "Chicken")
p <-  ggplot(cw, aes(x = Time, y = weight, col = Diet, group = Chick)) +
  geom_line() + geom_point()
pp <- ggplotly(p, tooltip = c("Chick"))
highlight(pp, on = "plotly_hover", selectize = TRUE)
Is there a way I can achieve this with ggiraph (without creating a shiny app and running a live R session)?
Code I use so far:
library(ggiraph)
set_girafe_defaults(opts_hover_inv = opts_hover_inv(css = "opacity:0.1;"))
p <-  ggplot(ChickWeight, aes(x = Time, y = weight,
                              colour = Diet, group = Chick,
                              tooltip = Chick, data_id = Chick)) +
  geom_line_interactive() + geom_point_interactive()
girafe(ggobj = p)
Thanks for your help!

