1

In R, and RStudio, I have run his code:

#ordinary kriging

mydata.krig <- krige(Clay~1, train_data, newdata=mask, vgm)

names(mydata.krig)
names(mydata.krig)[1] <- "Clay.pred"
names(mydata.krig)

min(mydata.krig$Clay.pred, na.rm=T); max(mydata.krig$Clay.pred, na.rm=T) 

ggplot() +
geom_stars(data = mydata.krig["Clay.pred"]) +
scale_fill_gradient(low = "yellow", high = "dark blue", limits = c(15.5486,61.41131)) +
geom_sf(data = thessaly_smus, color = "black", fill = NA, size = 1) +
labs(title = "%Clay Predicted Values - Ordinary Kriging, OK")

With ggplot, I have also acquired a map of the predicted values of %Clay. I want to extract this map as a raster file from R in order to open it in a GIS, but only the area of interest (coloured polygons). Can you provide me accurate code for this?

enter image description here

Updated* With the help of @I_O, I wrote the code as you can see in comments, but again this is not my outcome that I want to take.I took the following outcome: enter image description here

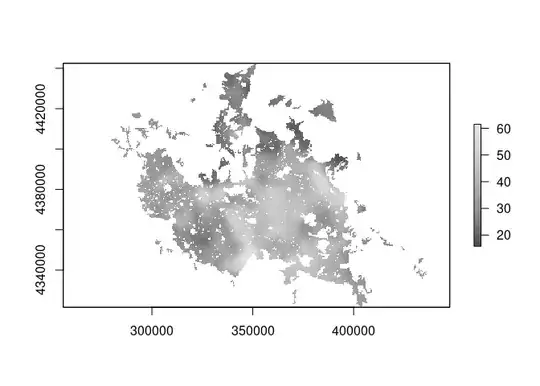
But I want to create a raster file like this that will contain the clay predictions: enter image description here

Dimitris K
  • 33
  • 5
  • "only area of polygon" will only work for rectangular polygons. Anyhow, you could try `ggplot() + ... + theme_void()` followed by `ggsave('imagename.tiff')`. – I_O Jul 02 '23 at 09:35
  • @I_O thanks for your help! If you could explain a bit more about rectangular polygons I would appreciate! With your help, I wrote the following code: ggplot() + geom_stars(data = mydata.krig["Clay.pred"]) + scale_fill_gradient(low = "yellow", high = "dark blue", limits = c(15.5486, 61.41131)) + geom_sf(data = thessaly_smus, color = "black", fill = NA, size = 1) + labs(title = "%Clay Predicted Values - Ordinary Kriging, OK") + theme_void() ggsave('Clay_Predictions.tiff') but still it is not the outcome I want. – Dimitris K Jul 02 '23 at 11:06
  • Why to write raster from ggplot object? Why not to rasterize your data with `{terra}` like https://search.r-project.org/CRAN/refmans/terra/html/rasterize.html ? – Grzegorz Sapijaszko Jul 02 '23 at 17:05
  • @GrzegorzSapijaszko can i do it in a n easy way? Basically, is it possible in the provided code that I wrote above? – Dimitris K Jul 02 '23 at 18:12
  • I assume your `mydata.krig` is a kind of data.frame with columns like longitude, latitude and some data. Then you may create `terra::vect` object (https://rdrr.io/cran/terra/man/vect.html) and rasterize it. And finally save as raster file. Would you mind to share the data, or the whole script you used to get `mydata.krig` object? – Grzegorz Sapijaszko Jul 02 '23 at 18:47
  • Greetings again @GrzegorzSapijaszko. Yes!Could you write me your email address in order to exchange material? – Dimitris K Jul 03 '23 at 06:46
  • @DimitrisK grzegorz(at)sapijaszko.net – Grzegorz Sapijaszko Jul 03 '23 at 07:10
  • @GrzegorzSapijaszko i have sent you. – Dimitris K Jul 03 '23 at 08:08
  • FYI for future reference: Stack Overflow discourages private email conversations because the site is supposed to be a knowledge base for future readers not a help center. – pppery Jul 05 '23 at 02:01
  • @GrzegorzSapijaszko thanks for sharing code as i cannot upload it for for an unknown reason! The only matter that i have to face,is that we should also set the raster's datum so as to project well without any warnings. – Dimitris K Jul 06 '23 at 04:35
  • @pppery You are absolutely right! Thats why we have uploaded the answer we found! I had an issue, so the colleague uploaded. We help others! Have a nice day!! – Dimitris K Jul 06 '23 at 04:36

1 Answers1

1
mydata.krig
#> stars object with 2 dimensions and 2 attributes
#> attribute(s):
#>                Min.  1st Qu.   Median      Mean   3rd Qu.     Max.  NA's
#> Clay.pred  15.80128 30.74017 36.38344  36.62676  43.28872  61.4972 63587
#> var1.var   85.52382 92.99561 96.14868 101.20852 100.43495 193.6164 63587
#> dimension(s):
#>   from  to  offset    delta              refsys x/y
#> x    1 346  267586  487.021 GGRS87 / Greek Grid [x]
#> y    1 248 4442456 -487.271 GGRS87 / Greek Grid [y]

as mydata.krieg is a stars object, it’s quite easy to convert it to raster

raster_ext <- sf::st_bbox(mydata.krig)
r <- raster::raster(t(mydata.krig[[1]]), 
       xmn = raster_ext[1], xmx = raster_ext[3],
       ymn = raster_ext[2], ymx=raster_ext[4],
       crs = sf::st_crs(mydata.krig)$proj4string)

terra::plot(r, col = grDevices::gray.colors(40))

and write it to file

raster::writeRaster(r, filename = "clay.tiff", overwrite = TRUE)
pppery
  • 3,731
  • 22
  • 33
  • 46
Grzegorz Sapijaszko
  • 1,913
  • 1
  • 5
  • 12