4

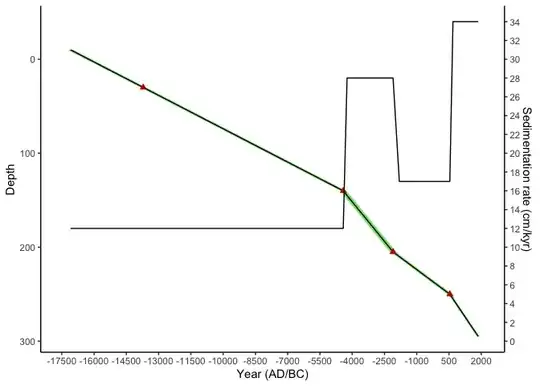
First, I plotted a line chart of Depth in function of Age. Then, I added a second y-axis : Sedimentation Rate.

The problem is that my first y-axis (Depth) should be reversed, going from 0 (top) to 310 (bottom).

But the second y-axis have to be normal from 0 (bottom) to 34 (top). there is my code :

library(ggplot2)

df <- data.frame(Depth_cm = c(5, 10, 15, 20, 25, 30, 35, 40, 45, 50, 55, 60, 65, 70, 75, 80, 85, 90, 95, 100, 105, 110, 115, 120, 125, 130, 135, 140, 145, 150, 155, 160, 165, 170, 175, 180, 185, 190, 195, 200, 205, 210, 215, 220, 225, 230, 235, 240, 245, 250, 255, 260, 265, 270, 275, 280, 285, 290, 295, 300, 305, 310
),
Year = c(1859, 1712, 1565, 1418, 1272, 1125, 978, 831, 684, 537, 244, -49, -343, -636, -929, -1222, -1516, -1809, -2102, -2280, -2458, -2636, -2814, -2992, -3170, -3348, -3527, -3705, -3883, -4061, -4239, -4417, -4840, -5262, -5685, -6108, -6530, -6953, -7376, -7798, -8221, -8644, -9066, -9489, -9912, -10334, -10757, -11180, -11603, -12025, -12448, -12871, -13293, -13716, -14139, -14561, -14984, -15407, -15829, -16252, -16675, -17097),
Incertainity = c(66, 66, 66, 66, 66, 66, 66, 66, 66, 115, 115, 115, 115, 115, 115, 115, 115, 115, 149, 149, 149, 149, 149, 149, 149, 149, 149, 149, 149, 149, 149, 133, 133, 133, 133, 133, 133, 133, 133, 133, 133, 133, 133, 133, 133, 133, 133, 133, 133, 133, 133, 133, 133, 133, 133, 133, 133, 133, 133, 133, 133, 133),
Rate = c(34, 34, 34, 34, 34, 34, 34, 34, 34, 17, 17, 17, 17, 17, 17, 17, 17, 17, 28, 28, 28, 28, 28, 28, 28, 28, 28, 28, 28, 28, 28, 12, 12, 12, 12, 12, 12, 12, 12, 12, 12, 12, 12, 12, 12, 12, 12, 12, 12, 12, 12, 12, 12, 12, 12, 12, 12, 12, 12, 12, 12, 12))


ggplot(df, aes(x = Year, y = Depth_cm)) +
  geom_ribbon(aes(xmin = Year - Incertainity, xmax = Year + Incertainity), alpha = 0.6, fill = "green3", size = 1) +
  geom_line(aes(linetype = ifelse((Year >= 2006 & Year <= 537) | (Year >= -13716 & Year <= -17097), "solid", "dotted"))) +
  geom_point(data = df[df$Year %in% c(537, -2102, -4417, -13716),], shape = "triangle", color = "red3", size = 2) +
  geom_line(aes(y = (Rate*10)))+
  scale_y_continuous(name = "Depth", sec.axis = sec_axis(~ . /10, name = "Sedimentation rate (cm/kyr)", breaks = seq(0, 34, by = 2))) +
  scale_x_continuous(name = "Year (AD/BC)", limits = c(-17500, 2100), breaks = seq(-17500, 2100, by = 1500)) +
  labs(x = "Year (AD/BC)", y = "Depth (cm)") +
  guides(linetype = FALSE) +
  theme_classic()

Depth axis needs to be reverse, but not the sedimentation rate axis

I tried the function scale_y_reverse, and also tried to use trans="reverse". But it change both of the axes.

I need to reverse only the Depth axis.

Also, I don't know if it is possible : I would like to make the second y-axis smaller like on the picture. Is there a function for that ? plot model that I would like to repeoduce

zx8754
  • 52,746
  • 12
  • 114
  • 209
Mlp
  • 41
  • 1

2 Answers2

3

You could change the labels by extracting an offset if I understand you correctly in scale_y_continuous like this:

df <- data.frame(Depth_cm = c(5, 10, 15, 20, 25, 30, 35, 40, 45, 50, 55, 60, 65, 70, 75, 80, 85, 90, 95, 100, 105, 110, 115, 120, 125, 130, 135, 140, 145, 150, 155, 160, 165, 170, 175, 180, 185, 190, 195, 200, 205, 210, 215, 220, 225, 230, 235, 240, 245, 250, 255, 260, 265, 270, 275, 280, 285, 290, 295, 300, 305, 310 ), Year = c(1859, 1712, 1565, 1418, 1272, 1125, 978, 831, 684, 537, 244, -49, -343, -636, -929, -1222, -1516, -1809, -2102, -2280, -2458, -2636, -2814, -2992, -3170, -3348, -3527, -3705, -3883, -4061, -4239, -4417, -4840, -5262, -5685, -6108, -6530, -6953, -7376, -7798, -8221, -8644, -9066, -9489, -9912, -10334, -10757, -11180, -11603, -12025, -12448, -12871, -13293, -13716, -14139, -14561, -14984, -15407, -15829, -16252, -16675, -17097), Incertainity = c(66, 66, 66, 66, 66, 66, 66, 66, 66, 115, 115, 115, 115, 115, 115, 115, 115, 115, 149, 149, 149, 149, 149, 149, 149, 149, 149, 149, 149, 149, 149, 133, 133, 133, 133, 133, 133, 133, 133, 133, 133, 133, 133, 133, 133, 133, 133, 133, 133, 133, 133, 133, 133, 133, 133, 133, 133, 133, 133, 133, 133, 133), Rate = c(34, 34, 34, 34, 34, 34, 34, 34, 34, 17, 17, 17, 17, 17, 17, 17, 17, 17, 28, 28, 28, 28, 28, 28, 28, 28, 28, 28, 28, 28, 28, 12, 12, 12, 12, 12, 12, 12, 12, 12, 12, 12, 12, 12, 12, 12, 12, 12, 12, 12, 12, 12, 12, 12, 12, 12, 12, 12, 12, 12, 12, 12))

library(ggplot2)
ggplot(df, aes(x = Year, y = Depth_cm)) + 
  geom_ribbon(aes(xmin = Year - Incertainity, xmax = Year + Incertainity), 
              alpha = 0.6, fill = "green3", size = 1) + 
  geom_line(aes(linetype = ifelse((Year >= 2006 & Year <= 537) | (Year >= -13716 & Year <= -17097), "solid", "dotted"))) + 
  geom_point(data = df[df$Year %in% c(537, -2102, -4417, -13716),], shape = "triangle", color = "red3", size = 2) + 
  geom_line(aes(y = (Rate*10)))+ 
  scale_y_continuous(name = "Depth", labels = function(x) abs(x - 300),
                     sec.axis = sec_axis(~ . /10, name = "Sedimentation rate (cm/kyr)", breaks = seq(0, 34, by = 2))) + 
  scale_x_continuous(name = "Year (AD/BC)", limits = c(-17500, 2100), breaks = seq(-17500, 2100, by = 1500)) + labs(x = "Year (AD/BC)", y = "Depth (cm)") + 
  guides(linetype = FALSE) + 
  theme_classic()

If you want to add more breaks you could add them like this (here I also changed the limits and offset):

library(ggplot2)
ggplot(df, aes(x = Year, y = Depth_cm)) + 
  geom_ribbon(aes(xmin = Year - Incertainity, xmax = Year + Incertainity), 
              alpha = 0.6, fill = "green3", size = 1) + 
  geom_line(aes(linetype = ifelse((Year >= 2006 & Year <= 537) | (Year >= -13716 & Year <= -17097), "solid", "dotted"))) + 
  geom_point(data = df[df$Year %in% c(537, -2102, -4417, -13716),], shape = "triangle", color = "red3", size = 2) + 
  geom_line(aes(y = (Rate*10)))+ 
  scale_y_continuous(name = "Depth", 
                     labels = function(x) abs(x - 310), limits = c(0, 310),
                     breaks = seq(0, 310, by = 10),
                     sec.axis = sec_axis(~ . /10, name = "Sedimentation rate (cm/kyr)", breaks = seq(0, 34, by = 2))) + 
  scale_x_continuous(name = "Year (AD/BC)", limits = c(-17500, 2100), breaks = seq(-17500, 2100, by = 1500)) + labs(x = "Year (AD/BC)", y = "Depth (cm)") + 
  guides(linetype = FALSE) + 
  theme_classic()

Created on 2023-06-29 with reprex v2.0.2

Quinten
  • 35,235
  • 5
  • 20
  • 53
  • Thank you for your answer. Both axes are in the correct order. However, the green line data needs to be reverse equally as the depth axis. Like for example : depth 0cm corresponding to 2000 year and depth 310cm corresponding to -17000 year. Is there a way to fix that ? – Mlp Jun 29 '23 at 14:11
  • 1
    Hi @Mlp, You could try and change your y aes to `y = rev(Depth_cm)`? – Quinten Jun 29 '23 at 14:24
  • It works perfectly now ! Thank you so much ! – Mlp Jun 30 '23 at 03:18
0

Thanks to both contributors, Final code and result : (data still availaible in the initial question post)

ggplot(df, aes(x = Year, y = rev(Depth_cm))) +  geom_ribbon(aes(xmin = Year - Incertainity, xmax = Year + Incertainity), alpha = 0.6, fill = "green3", size = 1) +  geom_line(aes(linetype = ifelse((Year >= 2006 & Year <= 537) | (Year >= -13716 & Year <= -17097), "solid", "dotted"))) + #geom_point(data = df[df$Year %in% c(-13716,-4417 , -2102,  537),], shape = "triangle", color = "red3", size = 2) +  geom_line(aes(y = (Rate/.35)))+   scale_y_continuous(name = "Depth (cm)", labels = function(x) abs(x - 300), sec.axis = sec_axis(~ . *0.35, name = "Sedimentation rate (cm/kyr)", breaks = seq(0, 34, by = 6))) + scale_x_continuous(name = "Year (AD/BC)", limits = c(-17500, 2100), breaks = seq(-17500, 2100, by = 1500)) + labs(x = "Year (AD/BC)", y = "Depth (cm)") + guides(linetype = FALSE) +  theme_classic()

Final plot

Mlp
  • 41
  • 1