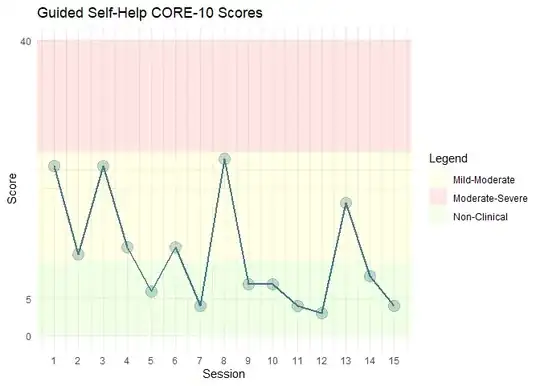
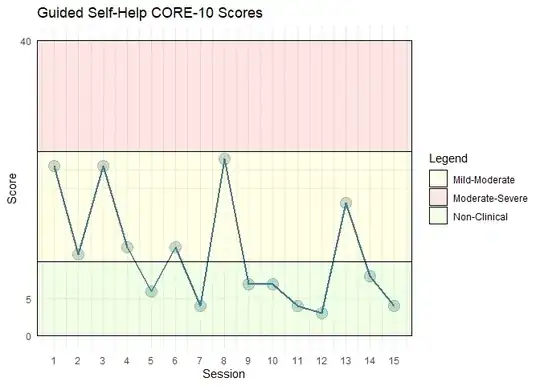
I'm creating a line graph showing clinical change over time for a client on the CORE-10. I want to remove the standard legend(which I've managed in the code below) and create a custom legend to show the shaded background area of my graph as: non-clinical, mild-moderate, moderate-severe. I've gotten somewhere with it, but can't seem to get the custom legend, any thoughts? TIA

My current code:
library(ggplot2)

ggplot(CORE10,aes(Session, Score, colour = ID)) +
 geom_point(size=5, alpha=0.3)+
  geom_line(size=1)+
  theme_minimal()+
  scale_y_continuous(limits= c(0,40), breaks = c(0, 5, 10, 15, 20, 25, 30, 35, 40))+
  scale_x_continuous(breaks = c(1, 2, 3, 4, 5, 6, 7, 8, 9, 10, 11, 12,13, 14 ,15))+
  theme(legend.position = "none")+
  labs(title="Guided Self-Help CORE-10 Scores") +
  geom_rect(xmin = -Inf, xmax =  Inf, ymin = 0, ymax = 10, fill = "lawngreen", alpha = .01)+
  geom_rect(xmin = -Inf, xmax =  Inf, ymin = 10, ymax = 25, fill = "yellow", alpha = .01) +
  geom_rect(xmin =  -Inf, xmax =  Inf, ymin = 25, ymax = 40, fill = "red", alpha = .01) +
  scale_fill_manual(name= "Legend", breaks=c("lawngreen", "yellow", "red" ),
                                    values= c("lawngreen", "yellow", "red"),
                                    labels=c("Non-Clinical", "Mild-Moderate", "Moderate-Severe"))
Data
CORE10 <- data.frame(
  ID = c(1, 1, 1, 1, 1, 1, 1, 1, 1, 1, 1, 1, 1, 1, 1),
  Session = c(1, 2, 3, 4, 5, 6, 7, 8, 9, 10, 11, 12, 13, 14, 15),
  Score = c(23, 11, 23, 12, 6, 12, 4, 24, 7, 7, 4, 3, 18, 8, 4)
)