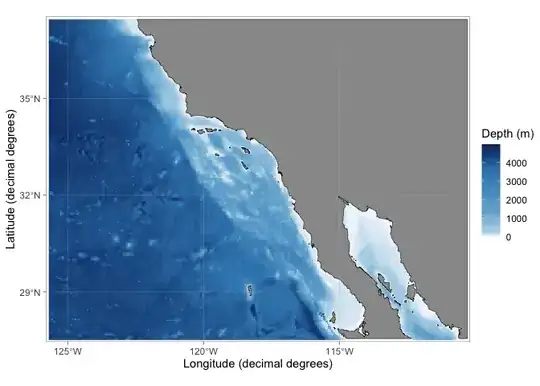
With the new version of ggOceanMaps (2.0; hopefully soon on CRAN), you can plot raster bathymetries up to 15 arc-second resolution:
library(ggOceanMaps)
#> Loading required package: ggplot2
#> ggOceanMaps: Setting data download folder to a temporary folder
#> /var/folders/9v/b70pd53x04d3jjmlrbcgp4_w0000gv/T//RtmpjBq0J0. This
#> means that any downloaded map data need to be downloaded again when you
#> restart R. To avoid this problem, change the default path to a
#> permanent folder on your computer. Add following lines to your
#> .Rprofile file: {.ggOceanMapsenv <- new.env(); .ggOceanMapsenv$datapath
#> <- 'YourCustomPath'}. You can use usethis::edit_r_profile() to edit the
#> file.'~/Documents/ggOceanMapsLargeData'would make it in a writable
#> folder on most operating systems.
options(ggOceanMaps.datapath = "~/Documents/ggOceanMapsLargeData")

packageVersion("ggOceanMaps")
#> [1] '2.0.0'

dt <- data.frame(lon = c(-125, -125, -111, -111), lat = c(28, 37, 37, 28))
basemap(data = dt, bathymetry = TRUE, bathy.style = "rcb")
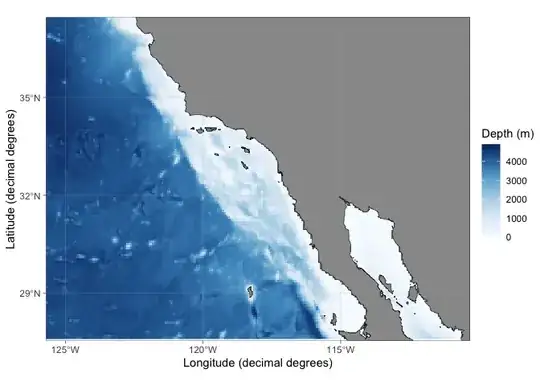
You can use any raster data, for example, marmap to download ETOPO raster data up to 15 arc-second resolution (see the resolution argument in marmap::getNOAA.bathy())
library(marmap); library(stars); library(sf)
#> Registered S3 methods overwritten by 'adehabitatMA':
#>   method                       from
#>   print.SpatialPixelsDataFrame sp
#>   print.SpatialPixels          sp
#>
#> Attaching package: 'marmap'
#> The following object is masked from 'package:grDevices':
#>
#>     as.raster
#> Loading required package: abind
#> Loading required package: sf
#> Linking to GEOS 3.11.0, GDAL 3.5.3, PROJ 9.1.0; sf_use_s2() is TRUE

limits <- auto_limits(dt, expand.factor = 1.1)$projLimits
bm <- basemap(data = dt)

mar_bathy <- marmap::getNOAA.bathy(lon1 = limits["xmin"], lon2 = limits["xmax"], lat1 = limits["ymin"], lat2 = limits["ymax"])
#> Querying NOAA database ...
#> This may take seconds to minutes, depending on grid size
#> Building bathy matrix ...
bathy <- raster_bathymetry(stars::st_as_stars(marmap::as.raster(mar_bathy)), depths = NULL)
#>   |                                                                              |                                                                      |   0%  |                                                                              |=========                                                             |  12%  |                                                                              |==================                                                    |  25%  |                                                                              |==========================                                            |  38%  |                                                                              |===================================                                   |  50%  |                                                                              |============================================                          |  62%  |                                                                              |====================================================                  |  75%  |                                                                              |=============================================================         |  88%  |                                                                              |======================================================================| 100%

p <- bm +
  stars::geom_stars(data = bathy$raster) +
  ggplot2::scale_fill_gradientn(
    name = "Depth (m)", breaks = seq(0,5e3,1e3), limits = c(0,NA),
    colors = colorRampPalette(c("#F7FBFF", "#DEEBF7", "#9ECAE1", "#4292C6", "#08306B"))(8)
  )

reorder_layers(p)
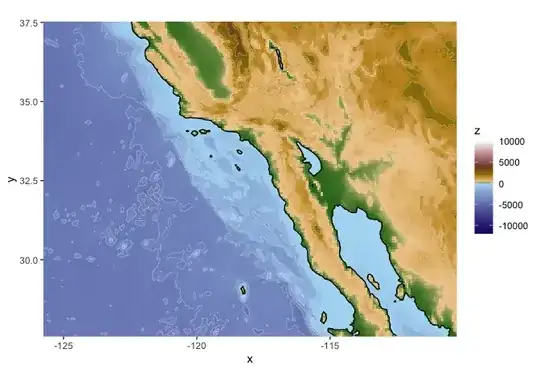
As for alternatives, you can also use the marmap package to plot bathymetric maps:
marmap::autoplot.bathy(mar_bathy, geom=c("r", "c"), colour="white", size=0.1) + marmap::scale_fill_etopo()
#> Warning in ggplot2::geom_raster(ggplot2::aes_string(fill = "z"), ...): Ignoring
#> unknown parameters: `colour` and `size`
Created on 2023-06-30 with reprex v2.0.2