0

I am trying to add the legends in my area chart but I have problems and I can't position them to the right of the chart, this is my code and this is my data data

library(ggplot2)

df <- read.csv("/home/pronostico_gas.csv")
gas <- as.data.frame(df[, 1:3])

ggplot(gas) +
  geom_area(aes(x = año, y = qg),
            colour = "#E2E418", fill = "#E2E418", alpha = 0.7, show.legend = TRUE) +
  geom_line(aes(x = año, y = np),
            colour = "#C5B21D", size=1, linetype = "dashed", show.legend = TRUE) +
  scale_x_continuous(breaks = gas$año) +
  scale_y_continuous(breaks = seq(0, 250, 40)) +
  labs(title = "Title", x = "año", y = "qo") +
  theme_classic() + 
  theme(plot.title = element_text(hjust = 0.5))

enter image description here

Miguel JV
  • 67
  • 5

1 Answers1

0

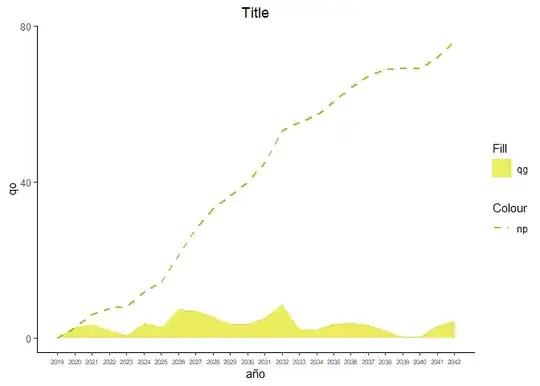
In the absence of reproducible data, this may be a help. Place the aesthetics you want to appear in the legend within the call to aes and control the appearance with scale_?_manual.

library(ggplot2)
#> Warning: package 'ggplot2' was built under R version 4.2.3


gas <- data.frame(año = 2019:2042,
                  qg = runif(24, 0, 9))

gas$np = cumsum(gas$qg)

ggplot(gas) +
  geom_area(aes(x = año, y = qg, fill = "qg"),
            colour = "#E2E418", alpha = 0.7) +
  geom_line(aes(x = año, y = np, colour = "np"),
            linewidth=1, linetype = "dashed")+
  scale_colour_manual(values = "#C5B21D")+
  scale_fill_manual(values = "#E2E418")+
  guides(colour = guide_legend(override.aes = list(fill = "white"))) +
  scale_x_continuous(breaks = gas$año) +
  scale_y_continuous(breaks = seq(0, 250, 40)) +
  labs(title = "Title", 
       x = "año", 
       y = "qo",
       colour = "Colour",
       fill = "Fill") +
  theme_classic() + 
  theme(plot.title = element_text(hjust = 0.5),
        axis.text.x = element_text(size = 6),
        legend.position = "right")

Created on 2023-06-21 with reprex v2.0.2

Peter
  • 11,500
  • 5
  • 21
  • 31