I have a table with the values that I want to display on Power BI Deneb Bar chart.
| LossReason | PrimaryQuantityLoss |
|---|---|
| Chupados | 1 |
| Generic Terminate | 18530 |
| Generic Terminate | 929 |
| Generic Terminate | 980 |
| Leitosas | 1 |
| Manchas | 1 |
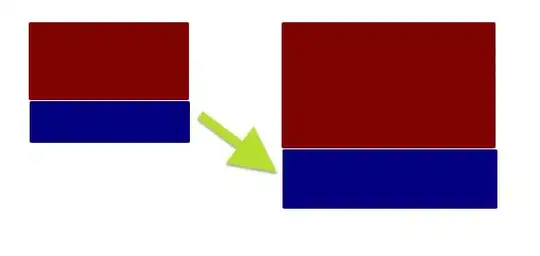
But the values are not aggregating Values stacked one above the others , the value displayed should be 20.439 instead of 18530/929/980 separated on the same bar.
I'm using the following specification:
{
  "data": {"name": "dataset"},

  "layer":[{
      "mark": "bar"},
    {
      "mark": {"type": "text", "color": "black", "xOffset": 8},
        "encoding": {
          "text": {"field": "PrimaryQuantityLoss", "type": "quantitative"}}
    }]
  ,

  "encoding": {
    "x": {
      "field": "PrimaryQuantityLoss",
      "type": "quantitative"
    },
    "y": {
      "field": "LossReason",
      "type": "ordinal"
    }
  }
}
I tried to do an aggregate by sum, but doesn't worked.


