I have a bar plot representing data of qty over several months and I used the solution suggested here to add a double x-axis: https://stackoverflow.com/a/75897246/15573456
With bigger dataset, it looks like the plot is adding calendar weeks on the x-axis that I don't have in the dataset. The dataset:
sample <- data.frame(service_type = c("A","B","C","A","B","A","B","C","C","A","B","C","A","B","C","A","B","C","A","B","C","A","B","C","A","B","C","A","B","C","A","B","C","A","B","C","A","B","C","A","B","C","A","B","C","A","B","C","A","B","C","A","B","A","B","C","C","A","B","C","A","B","C","A","B","C","A","B","C","A","B","C","A","B","C","A","B","C","A","B","C","A","B","C","A","B","C","A","B","C","A","B","C","A","B","C","A","B","C","A","B","C","A","B","C","A","B","C","A","B","C","A","B","C","A","B","C","A","B","C"),
                     qty = c(-20,-74,248,-32,-39,-17,-173,234,225,-22,-85,182,-41,-65,216,-35,-129,177,-29,-60,260,-29,-165,215,-16,-143,157,-17,-131,174,-25,-110,211,-11,-109,198,-19,-78,148,-17,-62,155,-31,-103,173,-17,-101,177,-16,-95,164,-14,-56,-32,-93,225,264,-27,-196,168,-25,-136,124,-17,-79,108,-33,-129,195,-16,-80,169,-12,-72,212,-20,-147,223,-14,-155,146,-24,-140,225,-28,-92,288,-31,-159,295,-28,-131,215,-22,-68,274,-20,-150,249,-17,-85,229,-28,-143,222,-32,-137,262,-19,-109,287,-33,-115,231,-23,-85,227,-27,-96,169),
                     xlabel2 = c("Sep-22","Sep-22","Sep-22","Oct-22","Oct-22","Mar-23","Mar-23","Mar-23","Oct-22","Oct-22","Oct-22","Oct-22","Oct-22","Oct-22","Oct-22","Oct-22","Oct-22","Oct-22","Oct-22","Oct-22","Oct-22","Nov-22","Nov-22","Nov-22","Mar-23","Mar-23","Mar-23","Nov-22","Nov-22","Nov-22","Mar-23","Mar-23","Mar-23","Apr-23","Apr-23","Apr-23","Apr-23","Apr-23","Apr-23","Apr-23","Apr-23","Apr-23","Apr-23","Apr-23","Apr-23","Apr-23","Apr-23","Apr-23","May-23","May-23","May-23","Sep-22","Sep-22","Nov-22","Nov-22","Nov-22","Sep-22","Aug-22","Aug-22","Aug-22","Aug-22","Aug-22","Aug-22","Jan-23","Jan-23","Jan-23","Jan-23","Jan-23","Jan-23","Jan-23","Jan-23","Jan-23","Jan-23","Jan-23","Jan-23","Feb-23","Feb-23","Feb-23","Feb-23","Feb-23","Feb-23","Feb-23","Feb-23","Feb-23","Aug-22","Aug-22","Aug-22","Aug-22","Aug-22","Aug-22","Feb-23","Feb-23","Feb-23","Sep-22","Sep-22","Sep-22","Mar-23","Mar-23","Mar-23","Sep-22","Sep-22","Sep-22","Nov-22","Nov-22","Nov-22","Dec-22","Dec-22","Dec-22","Dec-22","Dec-22","Dec-22","Dec-22","Dec-22","Dec-22","Dec-22","Dec-22","Dec-22","Dec-22","Dec-22","Dec-22"),
                     year_week = c("2022 - CW38","2022 - CW38","2022 - CW38","2022 - CW39","2022 - CW39","2023 - CW10","2023 - CW10","2023 - CW10","2022 - CW39","2022 - CW40","2022 - CW40","2022 - CW40","2022 - CW41","2022 - CW41","2022 - CW41","2022 - CW42","2022 - CW42","2022 - CW42","2022 - CW43","2022 - CW43","2022 - CW43","2022 - CW44","2022 - CW44","2022 - CW44","2023 - CW11","2023 - CW11","2023 - CW11","2022 - CW45","2022 - CW45","2022 - CW45","2023 - CW12","2023 - CW12","2023 - CW12","2023 - CW13","2023 - CW13","2023 - CW13","2023 - CW15","2023 - CW15","2023 - CW15","2023 - CW14","2023 - CW14","2023 - CW14","2023 - CW16","2023 - CW16","2023 - CW16","2023 - CW17","2023 - CW17","2023 - CW17","2023 - CW18","2023 - CW18","2023 - CW18","2022 - CW36","2022 - CW36","2022 - CW46","2022 - CW46","2022 - CW46","2022 - CW36","2022 - CW31","2022 - CW31","2022 - CW31","2022 - CW32","2022 - CW32","2022 - CW32","2023 - CW01","2023 - CW01","2023 - CW01","2023 - CW02","2023 - CW02","2023 - CW02","2023 - CW03","2023 - CW03","2023 - CW03","2023 - CW04","2023 - CW04","2023 - CW04","2023 - CW05","2023 - CW05","2023 - CW05","2023 - CW06","2023 - CW06","2023 - CW06","2023 - CW07","2023 - CW07","2023 - CW07","2022 - CW33","2022 - CW33","2022 - CW33","2022 - CW34","2022 - CW34","2022 - CW34","2023 - CW08","2023 - CW08","2023 - CW08","2022 - CW35","2022 - CW35","2022 - CW35","2023 - CW09","2023 - CW09","2023 - CW09","2022 - CW37","2022 - CW37","2022 - CW37","2022 - CW47","2022 - CW47","2022 - CW47","2022 - CW48","2022 - CW48","2022 - CW48","2022 - CW49","2022 - CW49","2022 - CW49","2022 - CW50","2022 - CW50","2022 - CW50","2022 - CW51","2022 - CW51","2022 - CW51","2022 - CW52","2022 - CW52","2022 - CW52") )
The code I used:
sample <- sample %>%
  mutate(date = as.Date(paste0(year_week, 1), "%Y - CW%U%u"))

sample %>%
  ggplot() +
  aes(x = date, fill = service_type, weight = qty) +
  geom_bar(position = "dodge") +
  scale_fill_hue(direction = 1) +
  scale_x_date(
    date_labels = "%Y - CW%U",
    date_breaks = "1 week",
    sec.axis = dup_axis(
      breaks = as.Date(paste0("5-", unique(sample$xlabel2)), "%d-%b-%y"),
      labels = \(x) format(x, "%b-%y")
    )
  ) +
  theme_minimal() +
  theme(legend.position = "left", axis.text.x.bottom = element_text(angle=90, hjust=1))
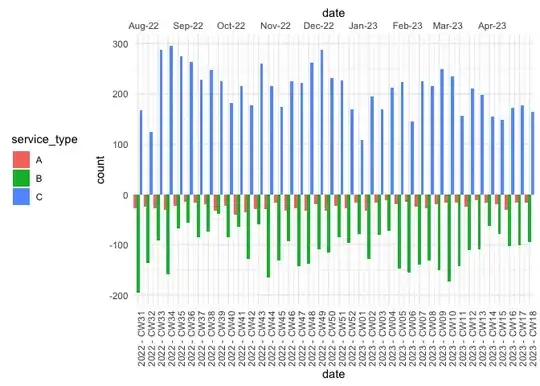
This is the plot:

You can see CW29/CW30 and CW19/CW20 added to the plot and not existing in the dataset. If I use the year_week instead of date the problem disappear but in that case I cannot use anymore the sec.axis option.