I am trying to create a function (inside an R package) that adds an image to the lower right corner of a ggplot. Since this will be included in a R package, I want this function to programmatically position this image to the bottom right of the plot, without any user intervention.
Here is what I have so far:
# Setup
library(tidyverse)
get_png <- function(filename) {
grid::rasterGrob(png::readPNG(filename), interpolate = TRUE)
}
# DaSL logo
l <- get_png("logo.png")
# Main function
add_dasl_logo <- function(logo) {
list(annotation_custom(logo, xmin = 5, xmax = 7.5, ymin = 0, ymax = 15),
coord_cartesian(clip = "off"),
theme(plot.margin = unit(c(1, 1, 3, 1), "lines"))
)
}
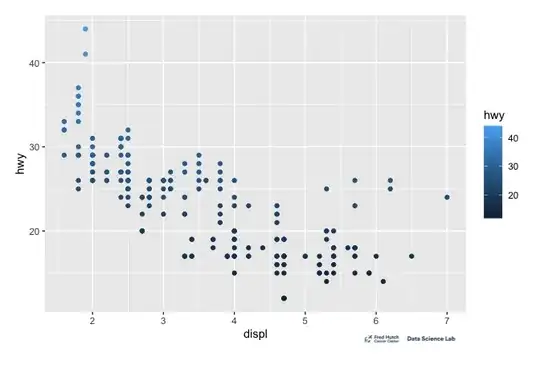
# Plot
ggplot(mpg, aes(displ, hwy, colour = hwy)) +
geom_point() +
add_dasl_logo(l)
Image file (logo.png): 
Right now, the x-y min/max locations are manually set for this specific ggplot. I don't expect the average ggplot2 user to figure out the xmin, xmax, ymin, ymax coordinates.
How do I programmatically find these coordinates and use them in add_dasl_logo() without any user intervention?