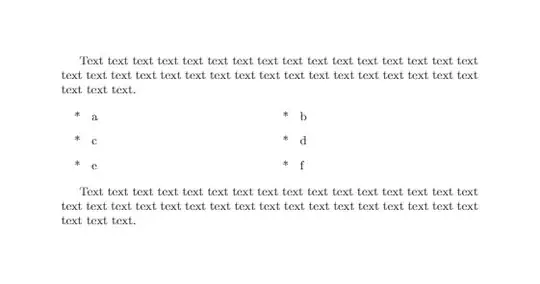
Instead of using layout or layout-ncol, we may follow the tricks described in the R Markdown Cookbook which works fine in case of Quarto too.
Define two new environment columns and column and use them in the pandoc divs (:::).
columns.tex
\newenvironment{columns}[1][]{}{}

\newenvironment{column}[1]{\begin{minipage}{#1}\ignorespaces}{%
\end{minipage}
\ifhmode\unskip\fi
\aftergroup\useignorespacesandallpars}

\def\useignorespacesandallpars#1\ignorespaces\fi{%
#1\fi\ignorespacesandallpars}

\makeatletter
\def\ignorespacesandallpars{%
  \@ifnextchar\par
    {\expandafter\ignorespacesandallpars\@gobble}%
    {}%
}
\makeatother

\usepackage{caption}
In the Quarto document, include the above tex file using include-in-header and then Wrap the contents you want to put side by side inside the columns div and then wrap each component within the column div. Note that, column divs needs to nested within the columns div, so use one extra : for columns div.
Use data-latex to specify the content width and note that I have used a blank column div to create some space between the content. Also note that, all of the column div width should be summed to 1.
---
title: "Column Test"
format: pdf
include-in-header: column.tex
---

:::: {.columns data-latex=""}

::: {.column data-latex="{0.60\textwidth}"}

```{python}
#| echo: false

import pandas as pd
import datetime as dt
import warnings
warnings.filterwarnings('ignore')
dates = [dt.date.today() + dt.timedelta(days=n) for n in range(100)]
values = range(100)
df = pd.DataFrame({'date':dates, 'values':values})
ax = df.set_index('date').plot()
```

\captionof{figure}{A meaningless figure}
\label{fig:myfigure}

:::

::: {.column data-latex="{0.03\textwidth}"}
\
<!-- an empty Div (with a white space), serving as
a column separator -->
:::

::: {.column data-latex="{0.37\textwidth}"}
```{python}
#| echo: false
#| label: tbl-mytable
#| tbl-cap: A meaningless Table
import pandas as pd
df = pd.DataFrame([[1,2,3],[4,5,6],[7,8,9],[1,2,3],[4,5,6],[7,8,9],
                [1,2,3],[4,5,6],[7,8,9],[1,2,3],[4,5,6],[7,8,9]], columns=['a','b','c'])
df
```

:::

::::

See \autoref{fig:myfigure} and @tbl-mytable
Caveats
Now there is a problem with this approach that we need to be aware of. If want to use a caption and want to refer to the figure later, we may be tempted to use fig-cap along label chunk option. But using these will break this solution. Because the column is environment is created based on minipage environment and using the aforementioned chunk options will create a figure environment. And figure environment must not be used inside a minipage.
So if we want to use figure caption and cross-referencing, we need to use raw latex commands captionof (from the caption latex package) and label, just after the figure code chunk.
rendered-output


