I am trying to change the aesthetics of my plot_model() graph and am struggling. Specifically, I'd like to:
- Make the 1:1 line (vline?) thicker
- Increase the font size of the labels
Current graph output when using the code below:

Here is the code I am currently using:
library(lme4)
library(ggplot2)
library(sjPlot)
# Run the model
plotModel <- glmer(used ~ BareGround + ConiferTreeCanopy + DeciduousTreeCanopy +
Developed + MesicGrass + MesicShrub + Water + XericGrass +
XericShrub + (1|id) + (1|month),
family = binomial(link = "logit"),
data = plotData, na.action="na.fail")
# Plot the results
set_theme(base = theme_light())
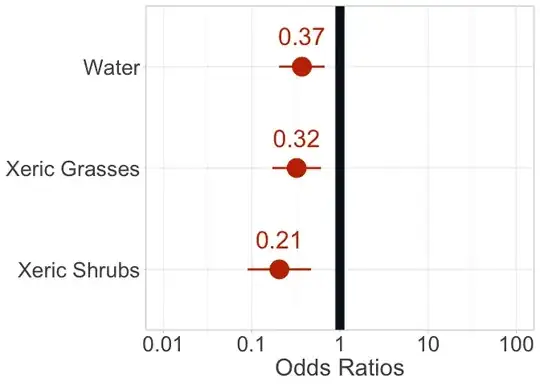
state1plot <- plot_model(plotModel, show.values = TRUE, show.p = FALSE,
value.offset = 0.3, title = "",
axis.labels = c("Xeric Shrubs", "Xeric Grasses", "Water",
"Mesic Shrubs", "Mesic Grasses", "Developed",
"Deciduous Tree Canopy", "Conifer Tree Canopy",
"Bare Ground"),
axis.lim = c(0.01, 20),
colors = c("#C43302", "#EDAA25"),
vline.color = "#061423",
dot.size = 8, line.size = 3) +
theme(text = element_text(size = 20))
state1plot