I am currently working on a project where I need to estimate changes in physical fitness over time using segmented regression with quantile regression in R. The data I'm working with consists of centile values from various tests, along with additional variables such as year, age group, weight status, and socioeconomic status (currently not in the model). I do have an ID column but there is only one observation per participant as this is an analysis of repeated cross-sectional data.
Here is a minimal, reproducible example of my data:
        id     ri_t600 leto_meritev weight_status2
1  6127454 0.179709154         2016         normal
2  3980838 0.978963377         2001     overweight
3  2774166 0.390405133         2007     overweight
4  1073113 0.025642580         2004         normal
5  6773578 0.238324573         1997         normal
6  5519253 0.994369221         1993     overweight
7  6838723 0.538462935         1997         normal
8  6016016 0.128138805         1994         normal
9  3215266 0.036528587         1991         normal
10 1963399 0.340610927         2013         normal
11  182440 0.963138367         2017     overweight
12 4669807 0.797643121         1994     overweight
13 4145886 0.180022262         2001         normal
14 7097019 0.803258459         2019         normal
15 4444052 0.119754080         1995         normal
16 4997667 0.001910298         2016         normal
17  935319 0.987400068         1993         normal
18 4996953 0.448889710         1989     overweight
19 1277313 0.239764074         2016         normal
20 4071109 0.160539785         2007         normal
21 5277830 0.991878782         1996         normal
22 1128991 0.321603180         2018         normal
23 2985130 0.429698600         2009         normal
24 5289288 0.108017596         1997         normal
25 3601256 0.781181377         2009         normal
26 3588296 0.861045956         2008         normal
27  749642 0.397665975         1993         normal
28 3364739 0.100899654         1990         normal
29 6415968 0.088997989         2018         normal
30 6418673 0.096091582         1990         normal
31 1051895 0.271999709         1990     overweight
32  884990 0.195473708         2015     overweight
33 4820890 0.645156168         2005     overweight
34 4005036 0.797750286         2004         normal
35 1275617 0.100194241         2018         normal
36 5458071 0.511416750         2011         normal
37  229093 0.138935340         2018         normal
38 6250384 0.618567227         2018         normal
39 5501375 0.053032507         1995         normal
40 2355478 0.317074434         2007         normal
41 5346473 0.194654348         2016         normal
42 6913525 0.237211849         2015         normal
43 2940600 0.606357737         1993         normal
44 2258047 0.521430525         2015         normal
45 2384073 0.550012191         2007         normal
46  881742 0.268146643         1990         normal
47 5758330 0.056041775         1996         normal
48 4198975 0.705752766         2013         normal
49  650372 0.322134155         1999         normal
50 1923040 0.877469326         1990         normal
To perform the analysis, I have written the following code:
seg_fit <- segmented.default(rq(ri_t600 ~ leto_meritev + weight_status2, tau = 0.50, data = boys_one), seg.Z = ~ leto_meritev, npsi = 1, control = seg.control(display = FALSE))
The boys_one data table contains 746,912 observations of boys belonging to the age group == 1 (one of the age groups). It includes three variables: ri_t600 (centile values for a 600-meter run), leto_meritev (year), and weight_status2 (two groups: normal and overweight). This was done to reduce the dataset.
Also, in segmented.default vcov is used to calculate the covariance matrix but does not work for the quantile regression object. Therefore, to get the covariance matrix for quantile regression I used this function:
vcov.rq <- function(object,...){
  sm <- summary(object, se = "ker", covariance = TRUE)$cov
  rownames(sm) <- colnames(sm) <- names(coef(object))
  return(sm)
}
EDIT: As I realized I further subsetted my data frame to only participants with normal weight/overweight and then segmented worked! However, now I have a different problem. The results I get are not of class segmented as it says. As I commented previously, one of my goals is to identify the magnitude of the increase or decrease observed in the interval by estimating the annual percent change (APC), defined as (exp(bj) − 1) × 100, where bj is the slope in segment j. This is based on Clegg et al. (2009) who proposed the average annual percent change (AAPC) computed as the sum of the slopes (βj) weighted by corresponding covariate sub-interval width (wj), namely:
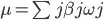
Since the weights are the breakpoint differences, the standard error of the AAPC should account for uncertainty in the breakpoint estimate. Again, it could be that I am misspecifying the function or the arguments relating to the quantile or segmented regression but I cannot compute the Schwarz information criterion (BIC) to select the optimal number of joinpoints and the AAPC from the segmented analysis I have done. The error I am getting with aapc() is that ogg[[2]] subscript is out of bounds. I am guessing that the problem with the aapc() function from the segmented package is in this part of the code: COV <- if(is.null(.vcov)) vcov(ogg,...) else .vcov
I would appreciate any suggestions or improvements to optimize the code and make it run efficiently. Additionally, if there are any alternative approaches or best practices for performing segmented regression with quantile regression in R, I would be grateful to know about them.
Thank you in advance for your help!