UPDATE: The suggested code here
p1 + p2 + p3 + plot_layout(ncol = 1) +
  plot_annotation(tag_levels = 'a') &
  theme(legend.justification = "left")
returned this

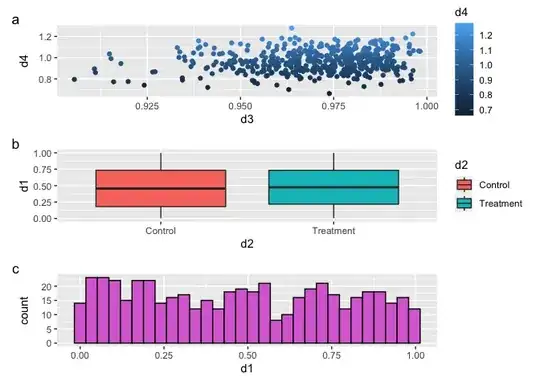
I need to have the legend groups aligned with the respective plots and I'm using this example from: https://gotellilab.github.io/GotelliLabMeetingHacks/NickGotelli/ggplotPatchwork.html
The desired output would have a larger space between the d4 and d2 groups, such that d4 is aligned with panel a and d2 panel b.
library(devtools)
install_github("thomasp85/patchwork")
library(ggplot2)
library(patchwork)

d1 <- runif(500)
d2 <- rep(c("Treatment","Control"),each=250)
d3 <- rbeta(500,shape1=100,shape2=3)
d4 <- d3 + rnorm(500,mean=0,sd=0.1)
plotData <- data.frame(d1,d2,d3,d4)
str(plotData)

p1 <- ggplot(data=plotData) + geom_point(aes(x=d3, y=d4, color = d4))# + theme(legend.position = "right")

p2 <- ggplot(data=plotData) + geom_boxplot(aes(x=d2,y=d1,fill=d2))# + theme(legend.position = "right")

p3 <- ggplot(data=plotData) +
  geom_histogram(aes(x=d1, color=I("black"),fill=I("orchid"))) #+ theme(legend.position = "right")

p1 + p2 + p3 + plot_layout(ncol = 1, guides = "collect") +
  plot_annotation(tag_levels = 'a') & theme(legend.position = "right")

The closest I could get is manipulating legend.key.height with & theme(legend.position = "right", legend.key.height = unit(2, "cm")), but this isn't ideal because the legends are still center-justified and it would be very time consuming to nudge the unit() command so the legend height is the same as the respective panel's.
Thanks for your time.