From data gathered in Azure AppInsights, I was able to generate a report of click counts of custom events for the last 7 days using the following Kusto query.
let usg_events = dynamic(["click_event"]);
let mainTable24 = customEvents
    | where timestamp > ago(8d) and isempty(operation_SyntheticSource)
    | extend name =replace("\n", "", name)
    | where '*' in (usg_events) or name in (usg_events)
    | extend dimension = tostring(customDimensions["click_event"])
    | where dimension != ""
    | summarize
        count_24h = countif(timestamp > ago(24h)),
        count_y = countif(timestamp > ago(2d) and timestamp < ago(1d)),
        count_2 = countif(timestamp > ago(3d) and timestamp < ago(2d)),
        count_3 = countif(timestamp > ago(4d) and timestamp < ago(3d)),
        count_4 = countif(timestamp > ago(5d) and timestamp < ago(4d)),
        count_5 = countif(timestamp > ago(6d) and timestamp < ago(5d)),
        count_6 = countif(timestamp > ago(7d) and timestamp < ago(6d))
        by dimension
    | project dimension, count_24h, count_y, count_2, count_3, count_4, count_5, count_6;
mainTable24
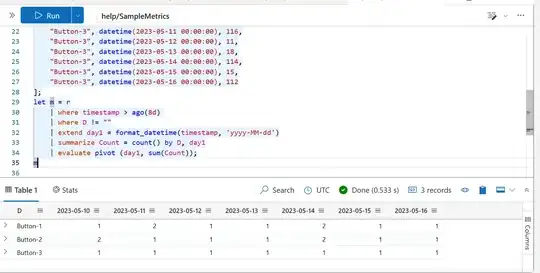
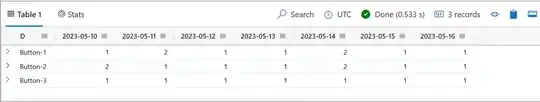
The Output looks like this:

The output shows the number of clicks per day per button for the last 7 days.
However, I was wondering if there is a better way to achieve this dynamically than to use if clauses for every single day ? As this isn't maintainable if I want to increase it for more days.