0

I want to apply the axis style in this post

R-style axes with ggplot

I did well with the y-axis but not with the x-axis because my x-axis was as a factor not a continues here is the code I use

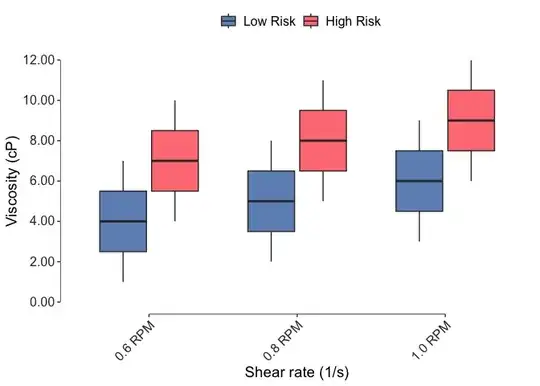
TKV_İmage <- ggplot(PE_plot5, aes(x = TKV, y = TKV_viscosity)) +
  geom_boxplot(width = 0.7, alpha = 0.8, aes(fill = as.factor(Risk_Group))) +
  scale_y_continuous(name = "Viscosity (cP)", labels = label_number(accuracy = 0.01)) +
  scale_x_discrete(name = "Shear rate (1/s)", labels = c("0.6 RPM", "0.8 RPM", "1.0 RPM", "5.0 RPM", "10.0 RPM", "15.0 RPM", "20.0 RPM", "25.0 RPM", "40.0 RPM", "60.0 RPM")) +
  scale_fill_manual(values = c("#4271AE", "#FF5A5F"), labels = c("Low Risk", "High Risk")) +
  theme_bw() +
  theme(axis.text.x = element_text(colour = "grey20", size = 12, angle = 45, hjust = 1),
        axis.text.y = element_text(colour = "grey20", size = 12, vjust = 0.4),
        axis.title = element_text(size = 14),
        legend.title = element_blank(),
        legend.position = "top",
        legend.text = element_text(size = 12),
        panel.border = element_blank(),
        panel.grid.major = element_blank(),
        panel.grid.minor = element_blank()) +
        base_breaks_y(PE_plot5$TKV_viscosity)

it's working fine but it doesn't show the X-axis

when I am adding this

 +
base_breaks_x(PE_plot5$factor(TKV))

throws this error

Error in pretty(x) : attempt to apply non-function

off course because the TKV is a factor I think

any help with this issue?

1 Answers1

0

As your x axis variable is a factor you have to adapt the code from the question you referenced to account for that by using e.g. scale_x_discrete instead of scale_x_continuous as well as the computation of the min and max breaks. Additionally I added a ... argument which allows to pass further arguments like name and labels to the scale.

Using some fake example data:

library(ggplot2)
library(scales)

PE_plot5 <- data.frame(
  TKV = c("A", "B", "C"),
  TKV_viscosity = 1:12,
  Risk_Group = rep(c("a", "b"), each = 3)
)

base_breaks_x_discrete <- function(x, ...) {
  b <- factor(x)
  bmin <- min(as.numeric(b))
  bmax <- max(as.numeric(b))
  d <- data.frame(y = -Inf, yend = -Inf, x = bmin, xend = bmax)
  list(
    geom_segment(
      data = d, aes(x = x, y = y, xend = xend, yend = yend),
      inherit.aes = FALSE
    ),
    scale_x_discrete(breaks = levels(b), ...)
  )
}

base_breaks_y <- function(x, ...) {
  b <- pretty(x)
  d <- data.frame(x = -Inf, xend = -Inf, y = min(b), yend = max(b))
  list(
    geom_segment(
      data = d, aes(x = x, y = y, xend = xend, yend = yend),
      inherit.aes = FALSE
    ),
    scale_y_continuous(breaks = b, ...)
  )
}

ggplot(PE_plot5, aes(x = TKV, y = TKV_viscosity)) +
  geom_boxplot(width = 0.7, alpha = 0.8, aes(fill = as.factor(Risk_Group))) +
  scale_fill_manual(
    values = c("#4271AE", "#FF5A5F"),
    labels = c("Low Risk", "High Risk")
  ) +
  theme_bw() +
  theme(
    axis.text.x = element_text(
      colour = "grey20",
      size = 12, angle = 45, hjust = 1
    ),
    axis.text.y = element_text(
      colour = "grey20",
      size = 12, vjust = 0.4
    ),
    axis.title = element_text(size = 14),
    legend.title = element_blank(),
    legend.position = "top",
    legend.text = element_text(size = 12),
    panel.border = element_blank(),
    panel.grid.major = element_blank(),
    panel.grid.minor = element_blank()
  ) +
  base_breaks_y(PE_plot5$TKV_viscosity,
    name = "Viscosity (cP)",
    labels = label_number(accuracy = 0.01)
  ) +
  base_breaks_x_discrete(PE_plot5$TKV,
    name = "Shear rate (1/s)",
    labels = c("0.6 RPM", "0.8 RPM", "1.0 RPM")
  )

stefan
  • 90,330
  • 6
  • 25
  • 51