1

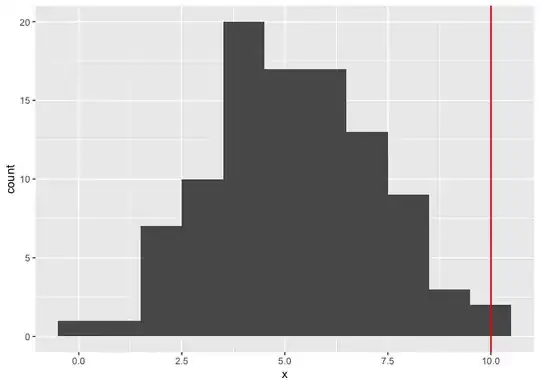
How can I add a geom_vline on the tallest bin of a histogram?

The following is not what I want, because it goes by max(x).

library(ggplot2)

set.seed(15)
df <- data.frame(x=rnorm(100,5,2))

df |> 
  ggplot(aes(x=x))+ 
  geom_histogram(binwidth = 1) +
  stat_bin(geom = "vline", aes(xintercept = after_stat(max(x) ) ), binwidth = 1, color = "red")

Created on 2023-05-04 with reprex v2.0.2

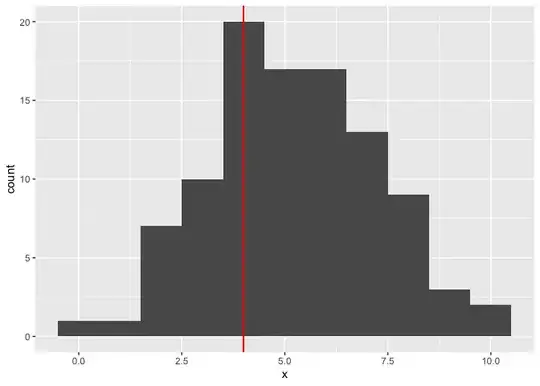
But I want the x value that corresponds to max(y).

Desired Output

enter image description here

Emman
  • 3,695
  • 2
  • 20
  • 44

1 Answers1

2

Using e.g. which.max you could do:

library(ggplot2)

set.seed(15)
df <- data.frame(x = rnorm(100, 5, 2))

df |>
  ggplot(aes(x = x)) +
  geom_histogram(binwidth = 1) +
  stat_bin(
    geom = "vline", aes(xintercept = after_stat(x[which.max(count)])),
    binwidth = 1, color = "red"
  )

stefan
  • 90,330
  • 6
  • 25
  • 51
  • would you care answering the equivalent to https://stackoverflow.com/questions/47000494/how-to-add-mean-and-mode-to-ggplot-histogram? – tjebo May 04 '23 at 13:43