I need help in plotting the estimates and 95% CI from Lmer model, i am using plot_model from sjplot function.
library(lme4)       # linear mixed-effects models
library(lmerTest)   # test for linear mixed-effects models
library(gtsummary)
library(sjPlot)
library(ggplot2)

names(trajectories)
library(tidyverse)


str(trajectories$yr_qun)

trajectories <- trajectories %>%
  mutate(yr_qun = yr_qun %>%
           fct_relevel("2001_low","2001_medium", "2001_high",
                       "2002_low","2002_medium", "2002_high",
                       "2003_low","2003_medium", "2003_high",
                       "2004_low","2004_medium", "2004_high",
                       "2005_low","2005_medium", "2005_high",
                       "2006_low","2006_medium", "2006_high",
                       "2007_low","2007_medium", "2007_high",
                       "2008_low","2008_medium", "2008_high",
                       "2009_low","2009_medium", "2009_high",
                       "2010_low","2010_medium", "2010_high"))

m1 <- lmer(distance ~ yr_qun + (1 | id), data = trajectories)
summary(m1)

p <- plot_model(m1, order.terms = rev(1:29)) + coord_cartesian()
p
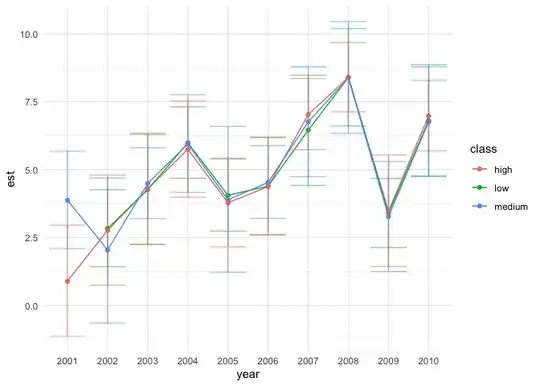
i would like to have a plot as shown in the following picture

here is dummy data
dput(trajectories)
structure(list(id = c(1L, 1L, 1L, 1L, 1L, 1L, 1L, 1L, 1L, 1L,
2L, 2L, 2L, 2L, 2L, 2L, 2L, 2L, 2L, 2L, 3L, 3L, 3L, 3L, 3L, 3L,
3L, 3L, 3L, 3L, 4L, 4L, 4L, 4L, 4L, 4L, 4L, 4L, 4L, 4L, 5L, 5L,
5L, 5L, 5L, 5L, 5L, 5L, 5L, 5L, 6L, 6L, 6L, 6L, 6L, 6L, 7L, 7L,
7L, 7L, 7L, 8L, 8L, 8L, 8L, 8L, 9L, 9L, 9L, 9L, 9L, 9L, 9L, 10L,
10L, 10L, 10L, 10L, 10L, 10L, 10L, 10L, 10L, 11L, 11L, 11L, 11L,
11L, 11L, 11L, 11L, 11L, 11L, 12L, 12L, 12L, 12L, 12L, 12L, 12L,
12L, 12L, 12L, 13L, 13L, 13L, 13L, 13L, 13L, 13L, 13L, 13L, 13L,
14L, 14L, 14L, 14L, 14L, 14L, 14L, 14L, 14L, 14L, 15L, 15L, 15L,
15L, 15L, 15L, 15L, 15L, 15L, 15L, 16L, 16L, 16L, 16L, 16L, 16L,
16L, 16L, 16L, 16L, 17L, 17L, 17L, 17L, 17L, 17L, 17L, 17L, 17L,
17L, 18L, 18L, 18L, 18L, 18L, 18L, 18L, 18L, 18L, 18L, 19L, 19L,
19L, 19L, 19L, 19L, 19L, 19L, 19L, 19L, 20L, 20L, 20L, 20L, 20L,
20L, 20L, 20L, 20L, 20L), year = c(2001L, 2002L, 2003L, 2004L,
2005L, 2006L, 2007L, 2008L, 2009L, 2010L, 2001L, 2002L, 2003L,
2004L, 2005L, 2006L, 2007L, 2008L, 2009L, 2010L, 2001L, 2002L,
2003L, 2004L, 2005L, 2006L, 2007L, 2008L, 2009L, 2010L, 2001L,
2002L, 2003L, 2004L, 2005L, 2006L, 2007L, 2008L, 2009L, 2010L,
2001L, 2002L, 2003L, 2004L, 2005L, 2006L, 2007L, 2008L, 2009L,
2010L, 2001L, 2002L, 2003L, 2004L, 2005L, 2006L, 2001L, 2002L,
2003L, 2004L, 2005L, 2006L, 2007L, 2008L, 2009L, 2010L, 2004L,
2005L, 2006L, 2007L, 2008L, 2009L, 2010L, 2001L, 2002L, 2003L,
2004L, 2005L, 2006L, 2007L, 2008L, 2009L, 2010L, 2001L, 2002L,
2003L, 2004L, 2005L, 2006L, 2007L, 2008L, 2009L, 2010L, 2001L,
2002L, 2003L, 2004L, 2005L, 2006L, 2007L, 2008L, 2009L, 2010L,
2001L, 2002L, 2003L, 2004L, 2005L, 2006L, 2007L, 2008L, 2009L,
2010L, 2001L, 2002L, 2003L, 2004L, 2005L, 2006L, 2007L, 2008L,
2009L, 2010L, 2001L, 2002L, 2003L, 2004L, 2005L, 2006L, 2007L,
2008L, 2009L, 2010L, 2001L, 2002L, 2003L, 2004L, 2005L, 2006L,
2007L, 2008L, 2009L, 2010L, 2001L, 2002L, 2003L, 2004L, 2005L,
2006L, 2007L, 2008L, 2009L, 2010L, 2001L, 2002L, 2003L, 2004L,
2005L, 2006L, 2007L, 2008L, 2009L, 2010L, 2001L, 2002L, 2003L,
2004L, 2005L, 2006L, 2007L, 2008L, 2009L, 2010L, 2001L, 2002L,
2003L, 2004L, 2005L, 2006L, 2007L, 2008L, 2009L, 2010L), distance = c(15,
20, 21.5, 23, 21, 21.5, 24, 25.5, 20.5, 24, 21, 20, 21.5, 23,
21, 21.5, 24, 25.5, 20.5, 24, 21, 20, 21.5, 23, 21, 21.5, 24,
25.5, 20.5, 24, 21, 20, 21.5, 23, 21, 21.5, 24, 25.5, 20.5, 24,
21, 20, 21.5, 23, 21, 21.5, 24, 25.5, 20.5, 24, 21, 20, 21.5,
23, 21, 21.5, 21, 20, 21.5, 23, 21, 21.5, 24, 25.5, 20.5, 24,
23, 21, 21.5, 24, 25.5, 20.5, 24, 15, 20, 21.5, 23, 21, 21.5,
24, 25.5, 20.5, 24, 15, 20, 21.5, 23, 21, 21.5, 24, 25.5, 20.5,
24, 15, 20, 21.5, 23, 21, 21.5, 24, 25.5, 20.5, 24, 15, 20, 21.5,
23, 21, 21.5, 24, 25.5, 20.5, 24, 15, 20, 21.5, 23, 21, 21.5,
24, 25.5, 20.5, 24, 15, 20, 21.5, 23, 21, 21.5, 24, 25.5, 20.5,
24, 15, 20, 21.5, 23, 21, 21.5, 24, 25.5, 20.5, 24, 15, 20, 21.5,
23, 21, 21.5, 24, 25.5, 20.5, 24, 15, 20, 21.5, 23, 21, 21.5,
24, 25.5, 20.5, 24, 15, 20, 21.5, 23, 21, 21.5, 24, 25.5, 20.5,
24, 15, 20, 21.5, 23, 21, 21.5, 24, 25.5, 20.5, 24), age = c(8L,
9L, 10L, 11L, 12L, 13L, 14L, 15L, 16L, 17L, 11L, 12L, 13L, 14L,
15L, 16L, 17L, 18L, 19L, 20L, 15L, 16L, 17L, 18L, 19L, 20L, 21L,
22L, 23L, 24L, 24L, 25L, 26L, 27L, 28L, 29L, 30L, 31L, 32L, 33L,
6L, 7L, 8L, 9L, 10L, 11L, 12L, 13L, 14L, 15L, 9L, 10L, 11L, 12L,
13L, 14L, 6L, 7L, 8L, 9L, 10L, 11L, 12L, 13L, 14L, 15L, 18L,
19L, 20L, 21L, 22L, 23L, 24L, 28L, 40L, 41L, 42L, 43L, 44L, 45L,
46L, 47L, 48L, 28L, 29L, 30L, 31L, 32L, 33L, 34L, 35L, 36L, 37L,
28L, 29L, 30L, 31L, 32L, 33L, 34L, 35L, 36L, 37L, 28L, 29L, 30L,
31L, 32L, 33L, 34L, 35L, 36L, 37L, 28L, 29L, 30L, 31L, 32L, 33L,
34L, 35L, 36L, 37L, 28L, 29L, 30L, 31L, 32L, 33L, 34L, 35L, 36L,
37L, 28L, 29L, 30L, 31L, 32L, 33L, 34L, 35L, 36L, 37L, 28L, 29L,
30L, 31L, 32L, 33L, 34L, 35L, 36L, 37L, 28L, 29L, 30L, 31L, 32L,
33L, 34L, 35L, 36L, 37L, 28L, 29L, 30L, 31L, 32L, 33L, 34L, 35L,
36L, 37L, 28L, 29L, 30L, 31L, 32L, 33L, 34L, 35L, 36L, 37L),
    Quintile = structure(c(5L, 2L, 3L, 3L, 2L, 2L, 4L, 2L, 5L,
    5L, 1L, 4L, 2L, 5L, 4L, 3L, 3L, 4L, 3L, 3L, 1L, 3L, 1L, 2L,
    1L, 5L, 2L, 4L, 1L, 4L, 3L, 2L, 5L, 3L, 4L, 4L, 3L, 1L, 4L,
    3L, 4L, 1L, 4L, 4L, 5L, 1L, 5L, 2L, 2L, 2L, 3L, 5L, 3L, 3L,
    4L, 1L, 3L, 1L, 1L, 5L, 2L, 4L, 1L, 3L, 2L, 4L, 1L, 3L, 4L,
    5L, 3L, 3L, 1L, 2L, 2L, 3L, 1L, 2L, 3L, 5L, 5L, 2L, 5L, 2L,
    2L, 3L, 1L, 2L, 3L, 5L, 5L, 2L, 5L, 2L, 2L, 3L, 1L, 2L, 3L,
    5L, 5L, 2L, 5L, 2L, 2L, 3L, 1L, 2L, 3L, 5L, 5L, 2L, 5L, 2L,
    2L, 3L, 1L, 2L, 3L, 5L, 5L, 2L, 5L, 2L, 2L, 3L, 1L, 2L, 3L,
    5L, 5L, 2L, 5L, 2L, 2L, 3L, 1L, 2L, 3L, 5L, 5L, 2L, 5L, 2L,
    2L, 3L, 1L, 2L, 3L, 5L, 5L, 2L, 5L, 2L, 2L, 3L, 1L, 2L, 3L,
    5L, 5L, 2L, 5L, 2L, 2L, 3L, 1L, 2L, 3L, 5L, 5L, 2L, 5L, 2L,
    2L, 3L, 1L, 2L, 3L, 5L, 5L, 2L, 5L), levels = c("Q1", "Q2",
    "Q3", "Q4", "Q5"), class = "factor"), sex = structure(c(2L,
    2L, 2L, 2L, 2L, 2L, 2L, 2L, 2L, 2L, 1L, 1L, 1L, 1L, 1L, 1L,
    1L, 1L, 1L, 1L, 2L, 2L, 2L, 2L, 2L, 2L, 2L, 2L, 2L, 2L, 1L,
    1L, 1L, 1L, 1L, 1L, 1L, 1L, 1L, 1L, 2L, 2L, 2L, 2L, 2L, 2L,
    2L, 2L, 2L, 2L, 2L, 2L, 2L, 2L, 2L, 2L, 1L, 1L, 1L, 1L, 1L,
    1L, 1L, 1L, 1L, 1L, 1L, 1L, 1L, 1L, 1L, 1L, 1L, 2L, 2L, 2L,
    2L, 2L, 2L, 2L, 2L, 2L, 2L, 2L, 2L, 2L, 2L, 2L, 2L, 2L, 2L,
    2L, 2L, 2L, 2L, 2L, 2L, 2L, 2L, 2L, 2L, 2L, 2L, 2L, 2L, 2L,
    2L, 2L, 2L, 2L, 2L, 2L, 2L, 2L, 2L, 2L, 2L, 2L, 2L, 2L, 2L,
    2L, 2L, 2L, 2L, 2L, 2L, 2L, 2L, 2L, 2L, 2L, 2L, 2L, 2L, 2L,
    2L, 2L, 2L, 2L, 2L, 2L, 2L, 2L, 2L, 2L, 2L, 2L, 2L, 2L, 2L,
    2L, 2L, 2L, 2L, 2L, 2L, 2L, 2L, 2L, 2L, 2L, 2L, 2L, 2L, 2L,
    2L, 2L, 2L, 2L, 2L, 2L, 2L, 2L, 2L, 2L, 2L, 2L, 2L, 2L, 2L,
    2L, 2L), levels = c("F", "M"), class = "factor"), yr_qun = structure(c(3L,
    4L, 8L, 11L, 13L, 16L, 21L, 22L, 27L, 30L, 1L, 6L, 7L, 12L,
    15L, 17L, 20L, 24L, 26L, 29L, 1L, 5L, 31L, 31L, 31L, 31L,
    19L, 24L, 25L, 30L, 2L, 4L, 9L, 11L, 15L, 18L, 20L, 22L,
    27L, 29L, 3L, 4L, 9L, 12L, 15L, 16L, 21L, 22L, 25L, 28L,
    2L, 6L, 8L, 11L, 15L, 16L, 2L, 4L, 7L, 12L, 13L, 18L, 19L,
    23L, 25L, 30L, 10L, 14L, 18L, 21L, 23L, 26L, 28L, 1L, 4L,
    8L, 10L, 13L, 17L, 21L, 24L, 25L, 30L, 1L, 4L, 8L, 10L, 13L,
    17L, 21L, 24L, 25L, 30L, 1L, 4L, 8L, 10L, 31L, 31L, 31L,
    24L, 25L, 31L, 31L, 31L, 8L, 10L, 13L, 17L, 21L, 24L, 25L,
    30L, 31L, 31L, 8L, 10L, 13L, 17L, 21L, 24L, 25L, 30L, 31L,
    31L, 8L, 10L, 13L, 17L, 21L, 24L, 25L, 30L, 31L, 31L, 8L,
    10L, 13L, 17L, 21L, 24L, 25L, 30L, 31L, 31L, 8L, 10L, 13L,
    17L, 21L, 24L, 25L, 30L, 31L, 31L, 8L, 10L, 13L, 17L, 21L,
    24L, 25L, 30L, 31L, 31L, 8L, 10L, 13L, 17L, 21L, 24L, 25L,
    30L, 31L, 31L, 8L, 10L, 13L, 17L, 21L, 24L, 25L, 30L), levels = c("2001_low",
    "2001_medium", "2001_high", "2002_low", "2002_medium", "2002_high",
    "2003_low", "2003_medium", "2003_high", "2004_low", "2004_medium",
    "2004_high", "2005_low", "2005_medium", "2005_high", "2006_low",
    "2006_medium", "2006_high", "2007_low", "2007_medium", "2007_high",
    "2008_low", "2008_medium", "2008_high", "2009_low", "2009_medium",
    "2009_high", "2010_low", "2010_medium", "2010_high", ""), class = "factor")), class = "data.frame", row.names = c(NA,
-183L))
any help much appreciated