I'm trying to plot a few 3D digital elevation models using rasterVis::plot3D.
The DEMs are originally geo tifs, they are all DEMs of the same location just different areas in that location and they all have the same coordinate reference system ("+proj=utm +zone=21 +south +datum=WGS84 +units=m +no_defs"), the only thing that differs is the spatial extent and resolution. One is an area of approx. 200 x 700 meters at 2 meter resolution and the rest are 1 x 1m at 1cm resolution. The x and y values are coordinates and z is elevation. They all plot just fine and look normal when plotting them in 2D.
However, when I plot the larger area 2m resolution DEM using rasterVis::plot3D I get a beautiful 3D plot:
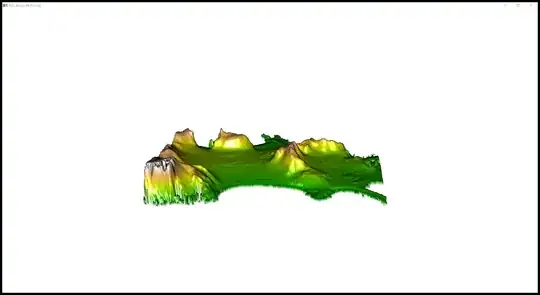
just as expected, but when I plot any of the smaller, finer resolution DEMs I get a very strange output
 .
.
I can't figure out what is causing this strange output.
Onedrive link to download the geo tif file
This is what Q1cm.tif looks like when plotted in 2D (the square is a plastic quadrat - we did a vegetation survey within the quadrat).

library(raster)
library(rasterVis)
library(rgl)

dem2m<-raster("lidar.tif")
dem1cm<-raster("Q1cm.tif")

dem2m
class      : RasterLayer
dimensions : 197, 292, 57524  (nrow, ncol, ncell)
resolution : 2, 2  (x, y)
extent     : 360047, 360631, 3080519, 3080913  (xmin, xmax, ymin, ymax)
crs        : +proj=utm +zone=21 +south +datum=WGS84 +units=m +no_defs
source     : lidar.tif
names      : lidar
values     : 18.7875, 59.18345  (min, max)

dem1cm
class      : RasterLayer
dimensions : 314, 336, 105504  (nrow, ncol, ncell)
resolution : 0.01, 0.01  (x, y)
extent     : 360091.7, 360095, 3080597, 3080601  (xmin, xmax, ymin, ymax)
crs        : +proj=utm +zone=21 +south +datum=WGS84 +units=m +no_defs
source     : memory
names      : Q1cm
values     : 54.84027, 55.15403  (min, max)

rgl::open3d()
plot3D(dem1cm)
Any ideas on what's going on or how to get around the issue?
Thanks in advance!
