0

I have plotted a PCA plot in R using ggplot2's geom_point function.

I would like to have a black color border around the points.

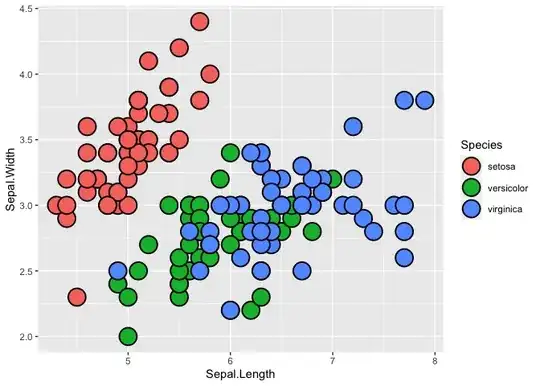
This is the code and picture before i gave color argument to geom_point

enter image description here

enter image description here

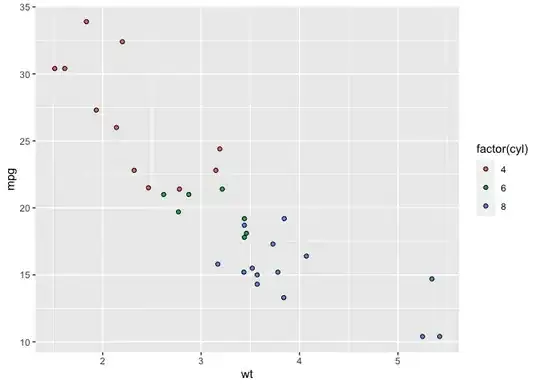
So here i want to introduce border around the dots for which i used color argument and following are the picture

enter image description here

enter image description here

as you can see the dots turned to black color. how to fix this and get the black border around the dots.

Thank you!

Retsi
  • 45
  • 3

3 Answers3

2

It has to do with color and shape of geom_point().

Originally, color of geom_point() in ggplot2 is the border color of points. That's why the result of your second code line rendered.

However, when designating a specific shape with fill, you can render color-filled points with black border.

Here's an example with iris data.

library(ggplot2)
iris |> 
  ggplot(aes(x=Sepal.Length, y=Sepal.Width))+
  geom_point(aes(fill=Species), color="black",shape=21, size=7,
             stroke =1)

Created on 2023-05-01 with reprex v2.0.2

Additionally, you can check the symbols of points here.

ggpubr::show_point_shapes()
#> Scale for y is already present.
#> Adding another scale for y, which will replace the existing scale.

Created on 2023-05-01 with reprex v2.0.2

YH Jang
  • 1,306
  • 5
  • 15
0

You want to map your condition variable to the fill aesthetic for your points, and let the color be black. For this to work you will also need to choose a different shape for your points, such as shape = 21

library(ggplot2)

ggplot(mtcars, aes(wt, mpg, fill = factor(cyl))) +
  geom_point(shape = 21, color = 'black')

Created on 2023-05-01 with reprex v2.0.2

Seth
  • 1,659
  • 1
  • 4
  • 11
0

You can use two geom_point layers in the plot and also the shape should be set on shape=1 or shape=21 etc. Here is an example:

library(ggplot2)
df <- data.frame(
  x=rnorm(10),
  y=rnorm(10),
  id=sample(c('red','green','blue'),10,replace = T)
)
ggplot(df, aes(x=x, y=y)) + 
  geom_point(aes(colour=id), size=12, show.legend = F) + 
  geom_point(shape = 21, size = 12, colour = "black")

and the output is: enter image description here

Afshin
  • 103
  • 6