Any tips for troubleshooting would be appreciated.
Background
- m6a.24Xlarge - Red Hat Enterprise Linux release 8.7 (Ootpa)
- PHP 7.4.30 (opcache)
- Apache/2.4.37 (Red Hat Enterprise Linux)
- 200+ WordPress sites
- All sites have a symlink to a central plugins repository IE /mnt/files/sites/plugins
- EFS Standard one-zone 14 TB
- Cache by Redis (same instance) with w3-total-cache plugin
We are running a large server with multiple sites m6a.24Xlarge. We had a 15TB EBS volume that with all of our websites on it. As the limit was quickly approaching, we decided to switch to EFS with the long-term goal of adding load balancing. Before implementing this, we put one of our largest customers on the EFS drive. There were no performance issues.
Slowly, I began to transfer sites over to the EFS volume creating symlinks to the EFS volume on the EBS. While transferring, I set cold access(IA) to 1 day to reduce the overall data storage costs during the transition phase. Once the initial transfer was completed, I performed a delta transfer and switched each site one at a time. IA set to 30 days.
Everything slowed down greatly once we reached the last 25% of the sites. I had thought that maybe it was data being transferred out of Cold storage (Infrequently Accessed). Performance did improve as data moved out of IA but we are still seeing issues 2 weeks later and the issue below has me to belive that we are hitting a bottleneck I can't locate.
When I switched everything to the EFS mount, the server would not work at all with the plugins folder in EFS (all sites use this folder for wp-contents/plugins via a symlink). I tried with all files out of IA (standard one-zone) but it still wouldn't work. This, I think, shows an example of the bottleneck we are seeing when the server comes under load. I ended up moving the plugins folder to a local EBS mount. This is now working fine as long as we don't get hit with higher traffic loads.
Issue
During medium/high traffic periods, CPU load is spiking above 700 (on a 96-core system) while overall CPU usage sits at exactly the same place between 30-40%. On the EBS volume, our CPU usage ranged from 30-70% depending on traffic. While CPU load spikes, PHP-FPM Workers shoot way up and sit there in D status. They appear to be the load waiting to be executed by the CPU. This causes overall slowdowns for our sites. Increasing workers for Apache or PHP does not seem to change the CPU usage.
Troubleshooting
- Attempted to increase PHP workers and Apache threads with zero effect positive or negative
- Using nload, Network load peaks at around 1.5GBps incoming (or 2GBps total). This doesn't appear to be a bottleneck
- RAM doesn't change much with an average 170 GB out of 370 GB
- strace on PHP-FPM worker is not showing anything strange at all. Everything appears to be finishing without any obvious hangups
ps -ax | grep php | grep -c Dis showing high numbers under medium/high loads. When this goes up, sites get slow.- EFS stats - IO usage is sitting around 35% with some spikes but never maxing out. Throughput usage is under 30%. We haven't touched our burst credits.

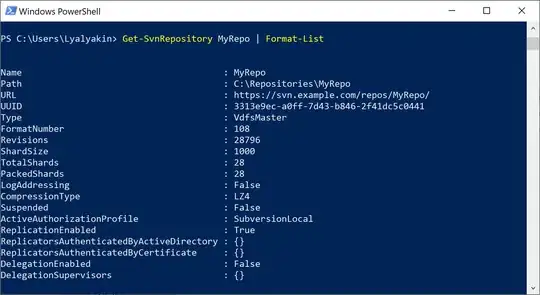
nfsiostatis showing everything in low ms. I am noticing that the nfsiostat doesn't seem to change much no matter what the load is on the server. (UPDATE -- seems to be changing more than I thought second image is under load)
- I've tried looking at a tcpdump from the server in wireshark but I'm not able to locate anything obvious. My abilities here are limited. I did find a good amount of connections with RTT of 7 seconds.
- Increased
ulimitto max. This did seem to help a bit. I also played around with settings for somaxconn and tcp_max_syn_backlog without any obvious effect. - EBS volume is not close to its throughput (400mb) / IOPS (8000) limit

EFS mount command
mount -t nfs4 -o nfsvers=4.1,rsize=1048576,wsize=1048576,hard,timeo=600,retrans=2,noresvport 172.00.00.1:/ /mnt/sitefiles
Apache
</IfModule>
    ServerLimit              4000
    StartServers              21
    MinSpareThreads           400
    MaxSpareThreads          1024
    ThreadsPerChild           200
    MaxRequestWorkers      7000
    MaxConnectionsPerChild 0
</IfModule>
PHP-FPM
pm.max_children = 2000
Next Steps?
Based on the flat performance of the CPU and nfsiostat, my gut says we are hitting a default network/system bottleneck somewhere. I've been unable to locate what this could be. If anyone has any advice on what to look at, please let me know. Any input would be greatly appreciated!

